
Figure 1.
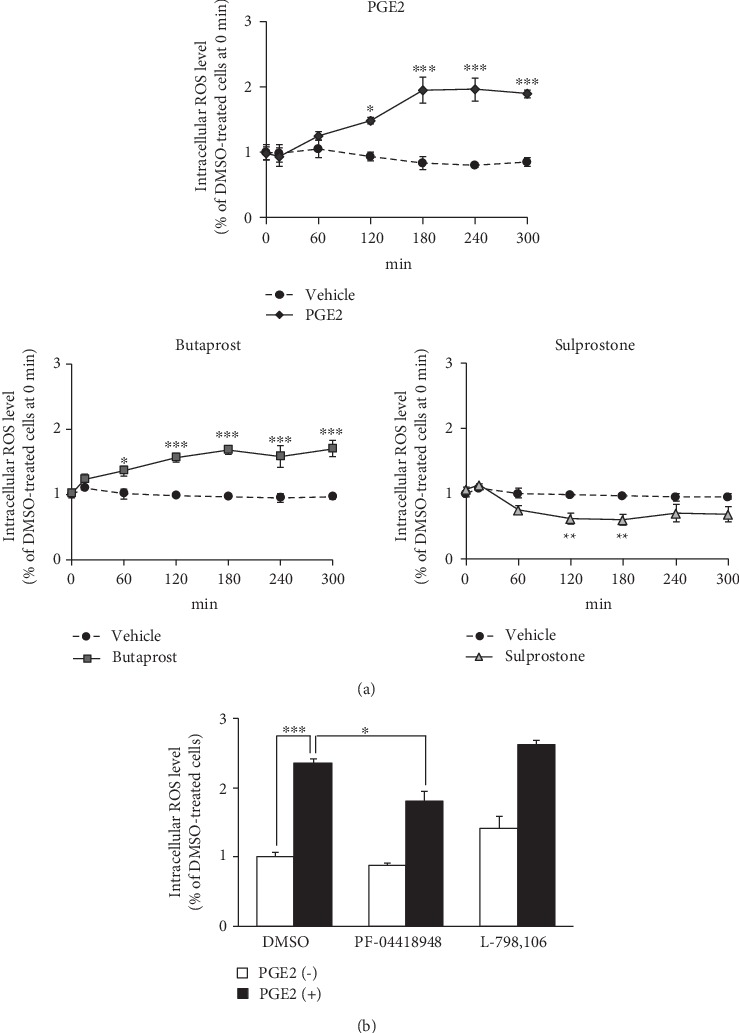
The intracellular ROS level in differentiated NSC-34 cells treated with PGE2 and EP agonist. (a) The intracellular levels of ROS were measured over time by monitoring DCF fluorescence intensity in differentiated NSC-34 cells incubated in vehicle (0.15% DMSO) or in the presence of PGE2 (80 μM), butaprost (40 μM), or sulprostone (40 μM). Graphs show time courses of DCF fluorescence intensity in the four groups, respectively. Values represent means ± S.E.M. for four separate experiments. ∗∗∗p < 0.001, ∗∗p < 0.01, ∗p < 0.05 compared to vehicle-treated cells at each time point. (b) Differentiated NSC-34 cells were treated with 30 μM PF-04418948 (an EP2 selective antagonist) or 10 μM L798,106 (an EP3 selective antagonist) with or without 80 μM PGE2 for 180 min. The graph illustrates the endpoint fluorescence values after these incubations. Each value represents the mean ± S.E.M. for four separate experiments. ∗∗∗p < 0.001, ∗p < 0.05 compared to vehicle-treated cells.