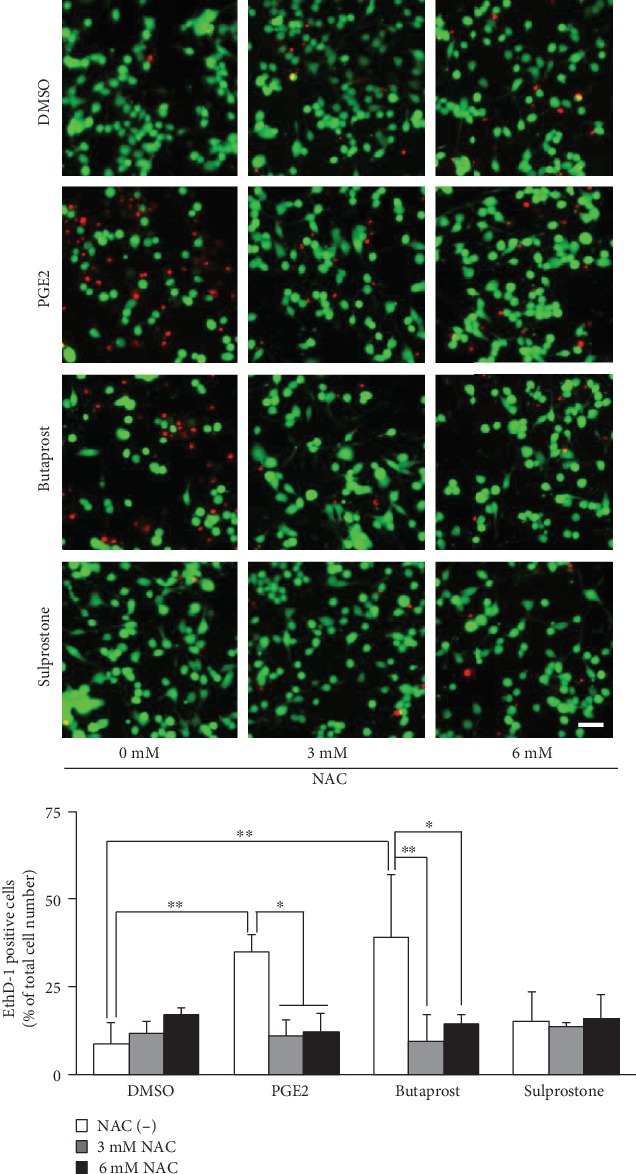
Figure 6.

LIVE/DEAD staining of differentiated NSC-34 cells treated with PGE2 and EP agonists. Differentiated NSC-34 cells were treated with vehicle (0.15% DMSO), 80 μM PGE2, 40 μM butaprost (an EP2 agonist), or 40 μM sulprostone (an EP1/3 agonist) in the presence or absence of NAC for 48 h. Photographs show typical fluorescence images of calcein-AM (green, live cells) and EthD-1 (red, dead cells) double staining in each treatment group. Scale bar indicates 50 μm. Graphs show the percentage of EthD-1-positive dead cells in these cells. Each value represents the mean ± S.D. for three different experiments. ∗∗p < 0.01, ∗p < 0.05.
