
Figure 5.
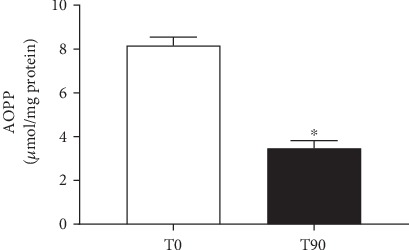
Levels of advanced oxidative protein products before and after probiotic supplementation. The results are expressed as mean ± SEM (n = 13). ∗p < 0.05 compared to T0.
Official websites use .gov
A
.gov website belongs to an official
government organization in the United States.
Secure .gov websites use HTTPS
A lock (
) or https:// means you've safely
connected to the .gov website. Share sensitive
information only on official, secure websites.
Levels of advanced oxidative protein products before and after probiotic supplementation. The results are expressed as mean ± SEM (n = 13). ∗p < 0.05 compared to T0.