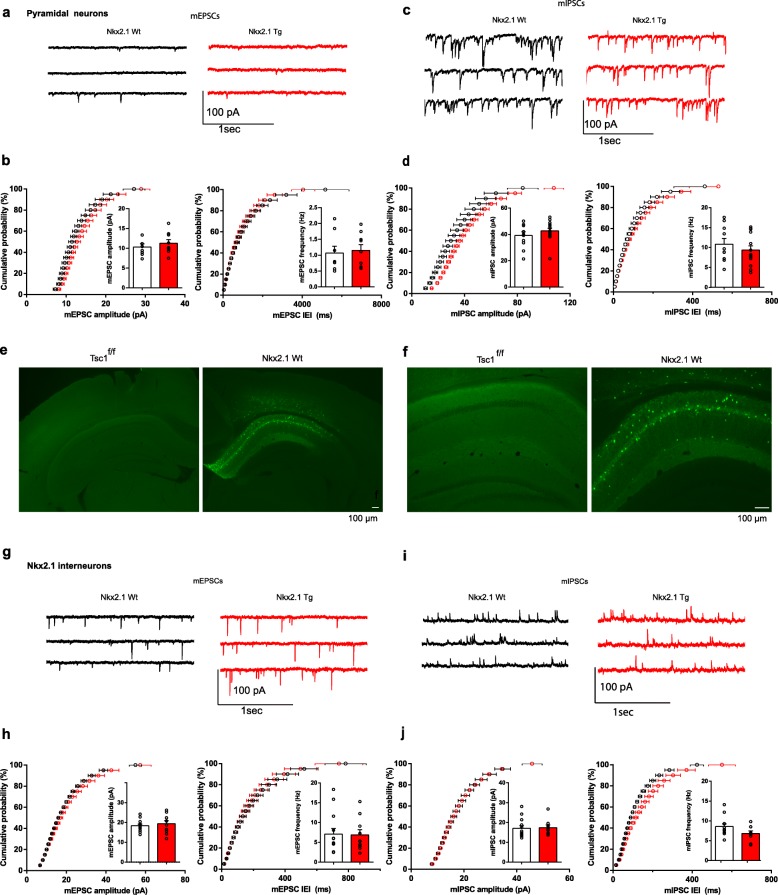
Fig. 4.
Intact miniature excitatory and inhibitory synaptic transmission in pyramidal cells and Nkx2.1 interneurons. a, b Representative traces (a) and graphs of cumulative probability (b) with group data (insets) showing unchanged mEPSC amplitude and frequency (or IEI, inter-event interval) in pyramidal cells of Nkx2.1Cre/wt;Tsc1f/wt mutant relative to control mice (n = 8 cells in Wt (Nkx2.1wt/wt;Tsc1f/wt) and 9 cells in Tg (Nkx2.1Cre/wt;Tsc1f/wt) mice; Kolmogorov-Smirnov tests for cumulative plots, Student’s t test for group data, p > 0.05). c, d Representative traces (c) and graphs of cumulative probability (d) with group data (insets) showing unchanged mIPSC amplitude and frequency (or IEI) in pyramidal cells of Nkx2.1Cre/wt;Tsc1f/wt mutant relative to control mice (n = 10 cells in Wt (Nkx2.1wt/wt;Tsc1f/wt) and 14 cells in Tg (Nkx2.1Cre/wt;Tsc1f/wt) mice; Kolmogorov-Smirnov tests and Student’s t tests, p > 0.05). e, f Fluorescence images at low (e) and high (f) magnification showing the presence (right) of EYFP-positive Nkx2.1 cells in Nkx2.1Cre/wt mouse injected with AAV2/9-DIO-EYFP in CA1 hippocampus and the absence of EYFP expression after similar injection in control Tsc1f/f mice. Scale bars in images at right apply also to images at left. g–j Similar electrophysiological data representation showing unchanged mEPSCs (g–h) and mIPSCs (i, j) in EYFP-expressing Nkx2.1 interneurons of Nkx2.1Cre/wt;Tsc1f/wt mutant relative to control mice (n = 13 cells in Wt (Nkx2.1Cre/wt;Tsc1wt/wt) and 9 cells in Tg (Nkx2.1Cre/wt;Tsc1f/wt) mice; Kolmogorov-Smirnov tests and Student’s t tests, p > 0.05). Note that in (g–j) mEPSCs and mIPSCs were recorded in the same interneurons at − 70 and 0 mV, respectively, resulting in outward mIPSCs (see the “Methods” section)

