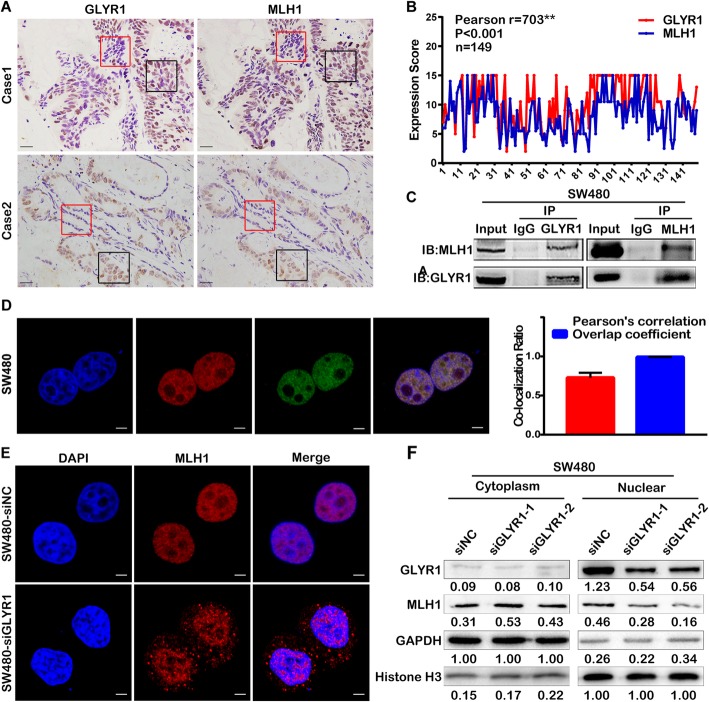
Fig. 2.
GLYR1 interacts with MLH1 and regulates its nuclear expression. a-b Correlation analysis of GLYR1 and MLH1 expression by immunohistochemical staining of paraffin-embedded human colorectal cancer tissue sections. Representative photographs of immunohistochemical staining are shown (200×, scale = 50 μm). The areas in the red and black panes indicate co-deficiency and co-expression, respectively. Pearson’s correlation analysis of GLYR1 and MLH1 according to immunohistochemical staining score, **r = 0.703, ***P < 0.001. c Co-immunoprecipitation was performed to validate the interaction between GLYR1 and MLH1 in SW480 cells. d Co-localization of GLYR1 (red) and MLH1 (green) in SW480 cells was assessed by laser-scanning confocal microscopy (× 2400, scale = 5 μm), DAPI (blue) stained nuclei. Error bars represent the mean ± SD of the Pearson’s correlation and overlap coefficient of GLYR1 and MLH1 (n = 5), *P < 0.05, **P < 0.01, ***P < 0.001. (E-F) Effect of GLYR1 knockdown on the expression and localization of MLH1 analyzed by immunofluorescence (× 2400, scale = 5 μm) and nucleoplasm separation assays. Grayscale values were normalized against GAPDH in the cytoplasm and histone H3 in the nucleus

