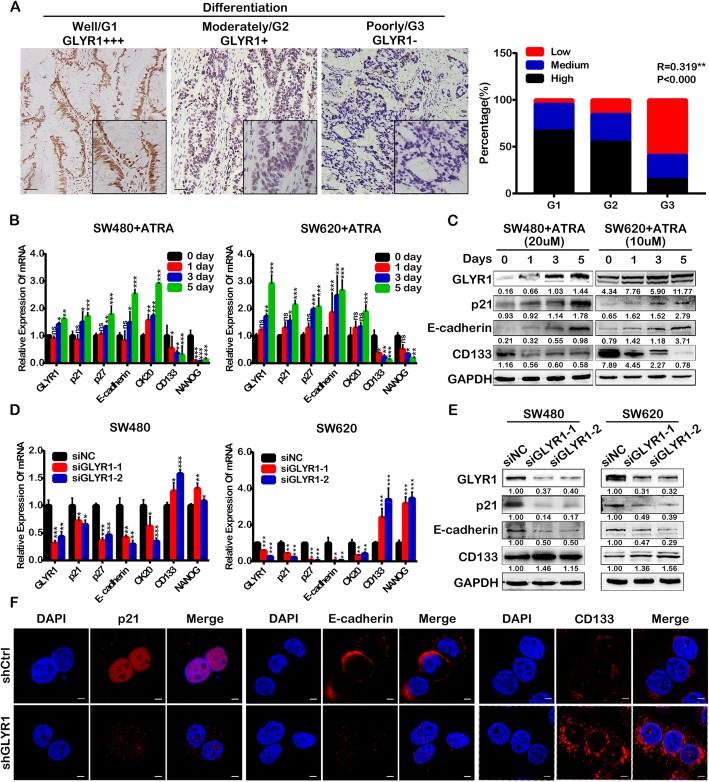
Fig. 4.
Downregulation of GLYR1 inhibits cell differentiation. a Representative photographs of GLYR1 immunohistochemical staining (× 200, scale = 50 μm) in cases with different degrees of differentiation. Spearman’s correlation analysis of GLYR1 expression (Low, Medium, High) and tumor grade (G1, G2, G3),** R = 0.319, ***P < 0.001. b Relative mRNA expression of cell differentiation-related genes (p21, p27, E-cadherin, CK20, CD133, NANOG) and GLYR1 was measured in SW480 and SW620 cells after ATRA treatment by qRT-PCR; GAPDH was used as an internal control. c Western blot analysis of the expression of E-cadherin, CD133, GLYR1, and p21 in SW480 and SW620 cells after ATRA treatment. d Relative mRNA expression of cell differentiation-related genes (p21, p27, E-cadherin, CK20, CD133, NANOG) was measured in GLYR1-knockdown SW480 and SW620 cells by qRT-PCR; GAPDH was used as an internal control. e Western blot analysis of the expression of E-cadherin, CD133, and p21 in GLYR1-knockdown SW480 and SW620 cells. f Immunofluorescent staining of the expression of p21, E-cadherin, and CD133 in GLYR1-knockdown SW480 cells (× 2400, scale = 5 μm); DAPI (blue) stained nuclei. Error bars represent the mean ± SD (n = 3), *P < 0.05, **P < 0.01, ***P < 0.001

