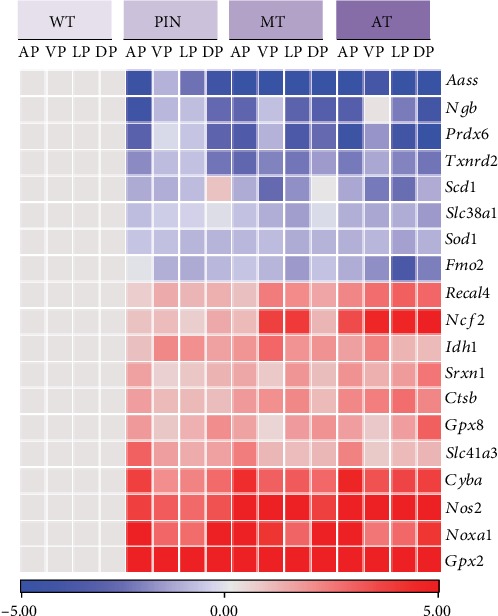
Figure 1.

Consensus deregulated oxidative stress genes in prostate tumors from Pb-Cre4; Ptenf/f mice. Heat map of oxidative stress response genes in the four lobes (anterior, AP; ventral, VP; lateral, LP; and dorsal prostate, DP) of wild-type (WT) prostate and tumor samples (prostatic intraepithelial neoplasia, PIN; medium-stage tumors, MT; and advanced-stage tumors, AT) from GEMM Pb-Cre4; Ptenf/f. Relative gene expression level (median) is showed as log2 fold change related to WT. Values between -5 and 0 represent downregulated genes (blue gradient) and between 0 and 5 upregulated genes (red gradient).
