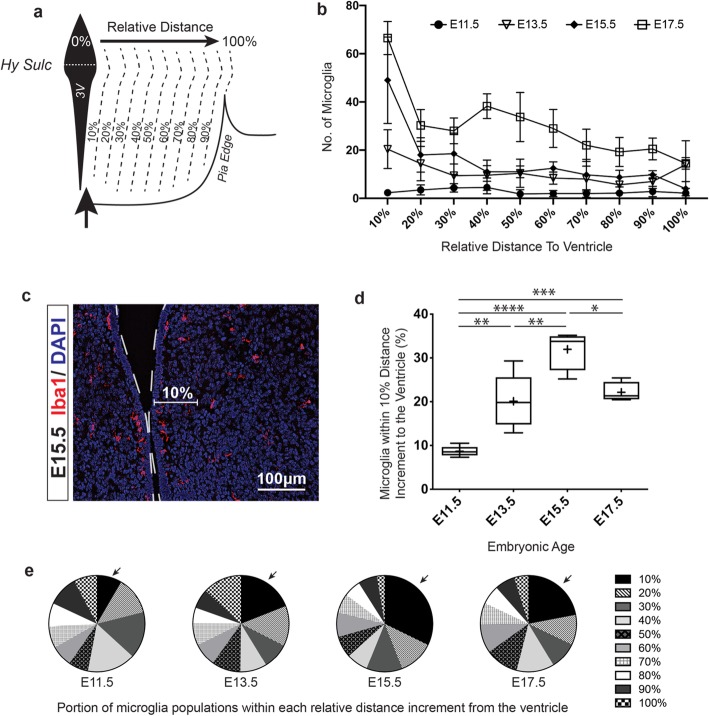
Fig. 2.
Microglia congregation at the third ventricle peaks at E15.5 in the embryonic tuberal hypothalamus. a Illustration depicting the measured relative distances to the third ventricle from the pia edge with a dotted line in the 3V labeling the hypothalamic sulcus (Hy Sulc), the dorsal border of the tuberal hypothalamus. b Total microglia population located within each 10% relative increment distance away from the third ventricle at mid- to late-embryonic time points. c Cropped Iba1 immunostaining of the third ventricle at E15.5 with the first 10% distance increment highlighted for better visualization. Third ventricle outlined as a dotted white line. d Box and Whisker plot representing the percentage of the microglia population that are located within the nearest 10% increment distance adjacent to the third ventricle at E11.5, E13.5, E15.5, and E17.5 embryonic time points (P < 0.0001). e Parts-of-whole plots showing mean percentage of the microglia population within each 10% relative increment distance away from the third ventricle as part of the total mean population at E11.5 (mean total = 27.7 ± 11.5), E13.5 (mean total = 107.2 ± 45.6), E15.5 (mean total = 152.2 ± 45.7), and E17.5 (mean total = 302.0 ± 40.4). Samples: Counts from the entire tuberal hypothalamic area in n = 6, 5, 4, 4 embryos for E11.5, E13.5, E15.5, and E17.5, respectively. Graphs: Parts-of-whole plots showing mean population percentage within each relative distance to the ventricle as part of the total mean population. Box and Whisker plots with middle line representing median, cross representing mean, box extending from the 25th to 75th percentiles, and whiskers at max and min values. Statistics: ANOVA with Tukey post hoc for multiple comparisons, *P ≤ 0.05, **P ≤ 0.01, ***P ≤ 0.001, ****P ≤ 0.0001

