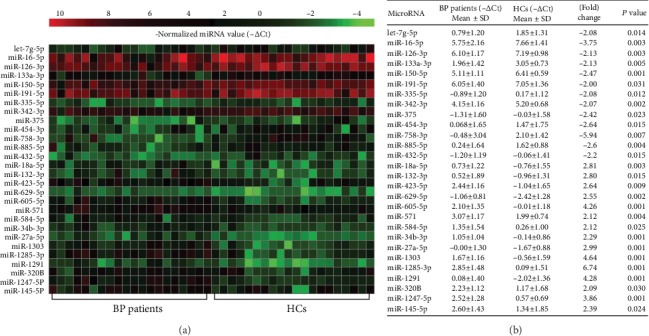
Figure 1.

Serum miRNAs differentially expressed within 20 BP patients as compared with the 20 healthy controls (HCs). (a) Heat map illustrates significantly dysregulated miRNAs using qPCR-based array. The vertical axis is constructed using the -ΔCt values of all 28 significantly upregulated or downregulated miRNAs (P < 0.05). The horizontal axis represents the 20 patients and the 20 HCs. (b) The mean -ΔCt values, fold change, and P values of the 13 significantly downregulated miRNA (with positive fold change) and the 15 significantly upregulated miRNAs (with negative fold change) in BP patients (P < 0.05).
