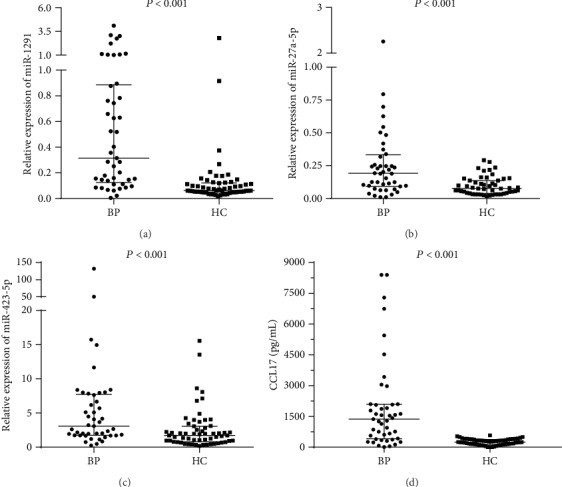
Figure 2.

Relative expression levels of serum (a) miR-1291, (b) miR-27a-5p, (c) miR-423-5p, and (d) serum CCL17 levels of the 45 patients and the 60 healthy controls are plotted. The median (and interquartile range) values are shown. BP: bullous pemphigoid; HC: healthy control.
