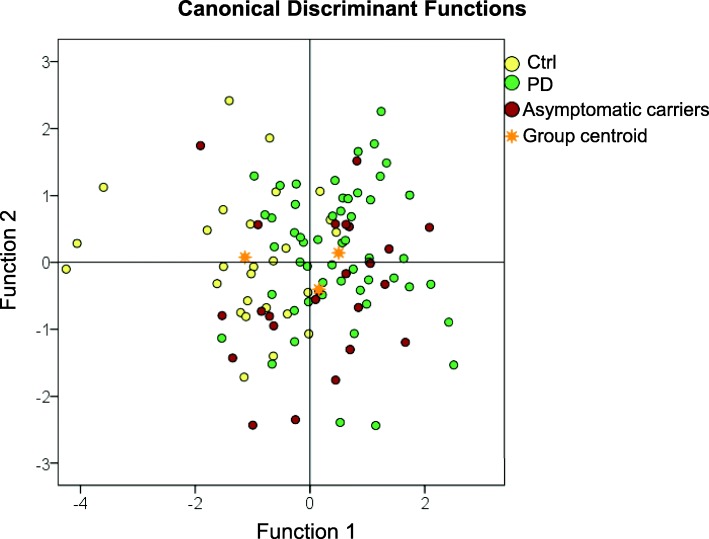
Fig. 2.
Discriminant function plot of canonical discriminant functions. CSF biomarkers were z-transformed before analyses. Discriminant function plot of canonical discriminant functions for discrimination of asymptomatic LRRK2 mutation carriers, PD and controls. Yellow dots indicate individual data of control subjects, green dots indicate individual data of Parkinson’s disease patients (sporadic and symptomatic LRRK2 mutation carriers) and red dots indicate individual data of LRRK2 asymptomatic carriers. The golden stars represent the group centroids

