
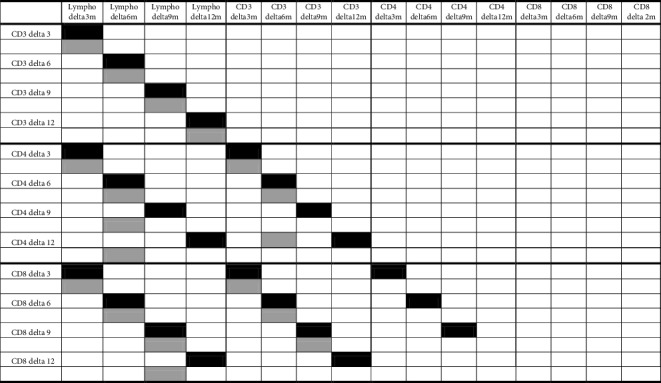
Table 2.
Correlation between variations of cell population at different time points.
|
VA is reported in black, and Eto is reported in grey. Correlation was determined by the Pearson correlation test: p < 0.05 at least for all the colored boxes.
Official websites use .gov
A
.gov website belongs to an official
government organization in the United States.
Secure .gov websites use HTTPS
A lock (
) or https:// means you've safely
connected to the .gov website. Share sensitive
information only on official, secure websites.
Correlation between variations of cell population at different time points.
|
|
VA is reported in black, and Eto is reported in grey. Correlation was determined by the Pearson correlation test: p < 0.05 at least for all the colored boxes.