Figure 4.

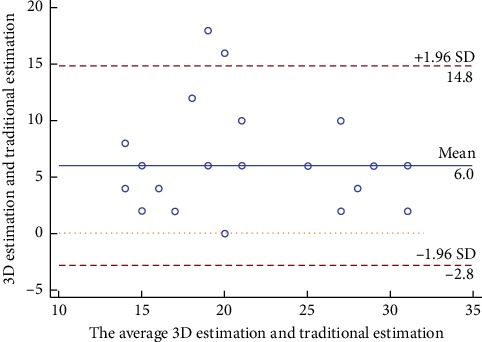
Bland–Altman plot analysis. Bland–Altman plot of empirical estimation versus 3D printed model estimation of occluder size.

Bland–Altman plot analysis. Bland–Altman plot of empirical estimation versus 3D printed model estimation of occluder size.