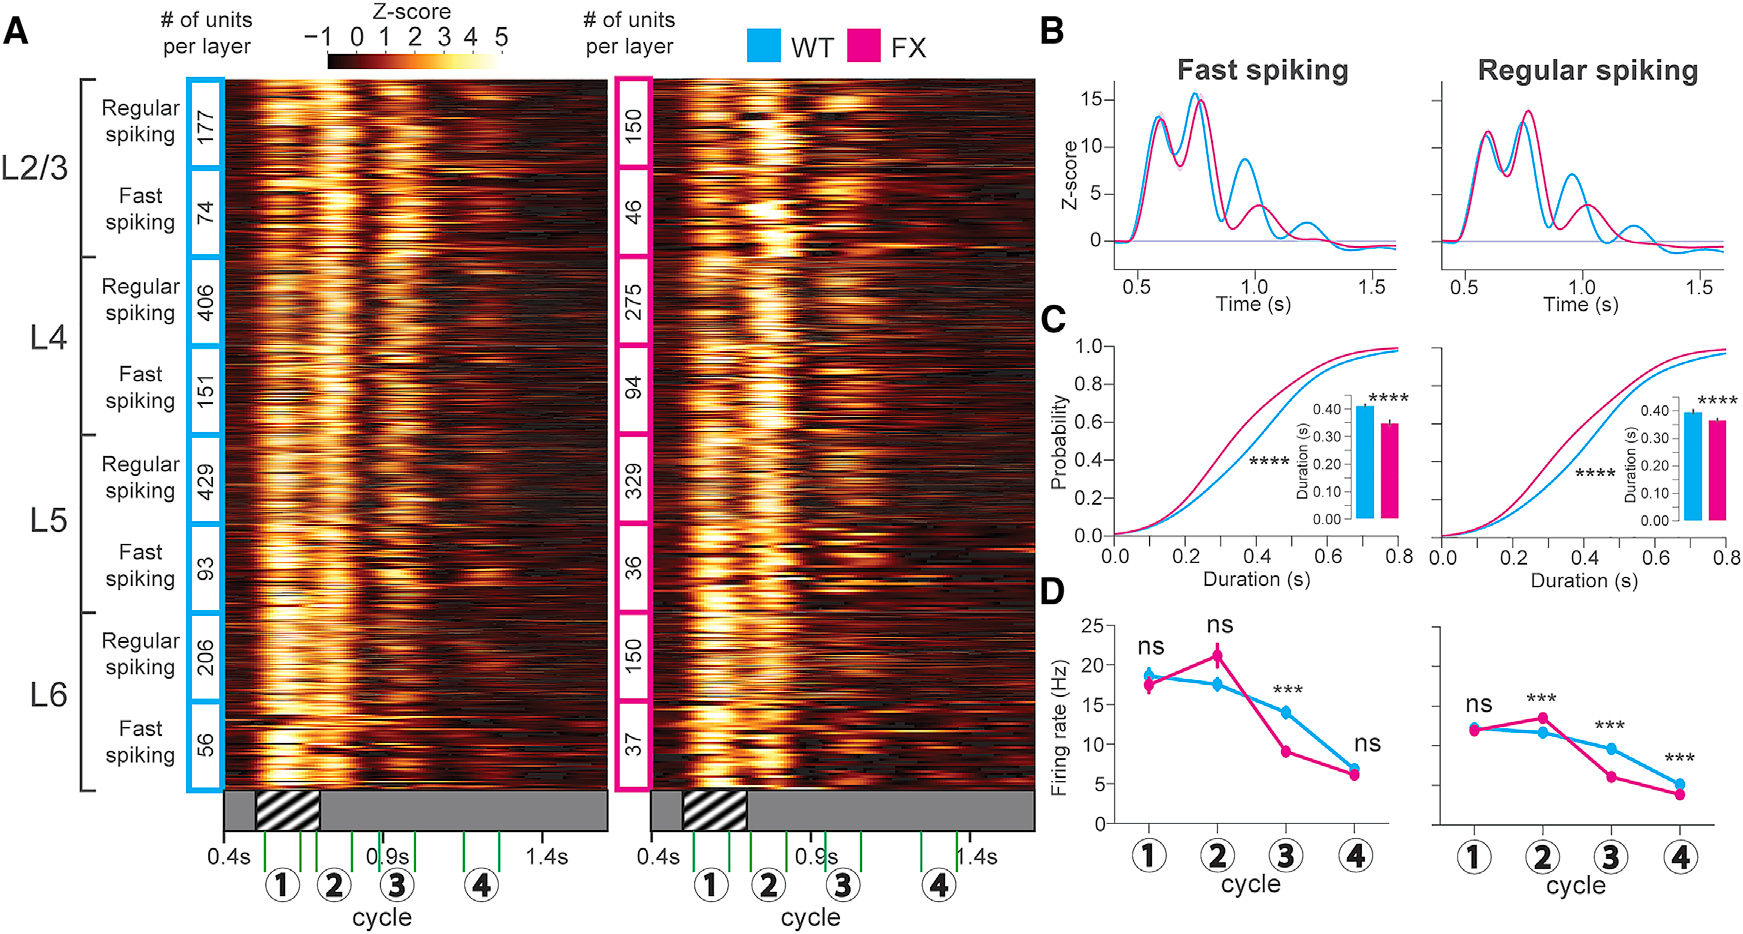
Figure 2. Decreased Duration of Visually Evoked Oscillations in FX Mice.

(A) Heatmaps showing the Z scored firing rates for oscillatory units from WT (cyan, 31 mice) and FX (magenta, 25 mice) mice after perceptual experience across all layers of V1. The numbers 1–4 indicate the timings of 4 cycles of the oscillation.
(B) Population (across all layers) Z score line plots.
(C) Cumulative distributions of oscillation duration. Inset: mean duration bar graphs are shown. FS cells: 2-sample Kolmogorov-Smirnov (KS) test of duration CDFs; WT versus FX duration: D(566) = 0.30; p = 3.81E–11. Welch’s t test of mean duration: t(566) = 3.73; p = 2.1E–4 (units after peak detection: WT FS n = 362; FX FS n = 206). RS cells: 2-sample KS test of duration CDFs; WT versus FX duration: D(1,993) = 0.27, p = 1.35E–33. Welch’s t test of mean duration: t(1,993) = 6.65; p = 3.77E–11 (units after peak detection: WT RS n = 1,152; FX RS n = 843). Error bars indicate SEM. *p < 0.05; **p < 0.01; ***p < 0.001; ****p < 0.0001.
(D) Mean firing rates at 4 oscillation cycles between WT and FX. LMM analysis for FS cells after perceptual experience: genotype: F1,585 = 1.0; p = 0.32. Oscillation no.: F3,1755 = 472; p < 1E–4. Genotype/oscillation no. interaction: F3,1755 = 27.2; p < 1E–4. LS means test (Bonferroni corrected): cycle(1): estimate: −1.24E–2; t(1,036) = −0.15; p = 1.0. (2): estimate: 0.19; t(1,036) = 2.37; p = 0.07. (3): estimate: −0.41; t(1,036) = −5.08; p < 4E–4. (4): estimate: −4.54E–2; t(1,036) = −0.56; p = 1.0. SE: 8.13E–2. LMM analysis for RS cells after perceptual experience: genotype: F1,2120 = 25.5; p < 1E–4. Oscillation no.: F3,6,360 = 1,902.23; p = 1E–4. Genotype/oscillation no. interaction: F3,6360 = 141.13; p < 1E–4. LS means test (Bonferroni corrected): cycle(1): estimate: −4.05E 2; t(4,333) = 1.34; p = 0.72. (2): estimate: −0.145; t(4,333) = 4.81; p < 4E–4. (3): estimate: −0.41, t(4,333) = 13.7; p < 4E–4. (4): estimate: −0.19; t(4,333) = −6.33; p < 4E–4. SE: 3.02E–2.
See also Figures S1–S8 and Table S1.
