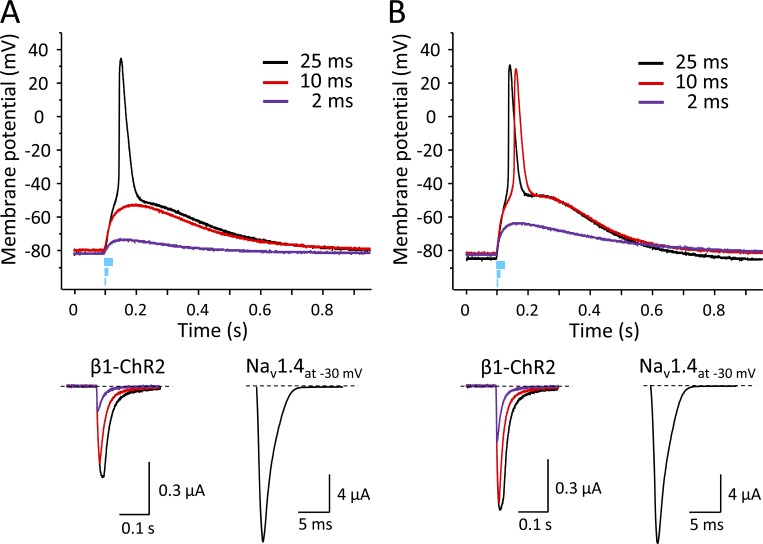
Figure 11.
Effect of light pulse duration in two different oocytes coexpressing Nav1.4, β1-ChR2, and Kv2.1 on the membrane potential and on the corresponding photocurrent. Duration of the light flashes was 25, 10, and 2 ms. Amounts of coinjected cRNA per oocyte were 10 ng Nav1.4, 2.75 ng β1-ChR2, and 50 pg Kv2.1. (A) The 25-ms pulse induced a peak photocurrent of 0.51 µA, which led to successful AP triggering in this oocyte (black line). In contrast, 10 and 2 ms were too short to activate a sufficient number of β1-ChR2 channels, so the threshold potential was not achieved (red and purple lines, respectively). Light-induced peak currents were 0.44 and 0.14 µA, respectively. (B) Blue-light pulses induced larger photocurrents, indicating a higher β1-ChR2 expression level. The 25-ms pulse resulted in a peak photocurrent of 0.70 µA and produced a typical AP (black). The short 2-ms pulse was not sufficient to elicit an AP. The corresponding light-induced current of 0.31 µA was larger than in A, and consequently, the subthreshold depolarization was more pronounced (compare purple curves in upper graphs in A and B). Application of an intermediate pulse (10 ms, red) resulted in a peak photocurrent of 0.67 µA, and in above-threshold activation. However, depolarization was delayed compared with the longer light pulse of 25 ms. In both oocytes, the membrane resistance as well as the Nav1.4 current at −30 mV were very similar (0.59 MΩ and 16.6 µA in A and 0.5 MΩ and 16.9 µA in B, respectively). K+ currents at +70 mV were 6.4 µA (A) and 8.0 µA (B).

