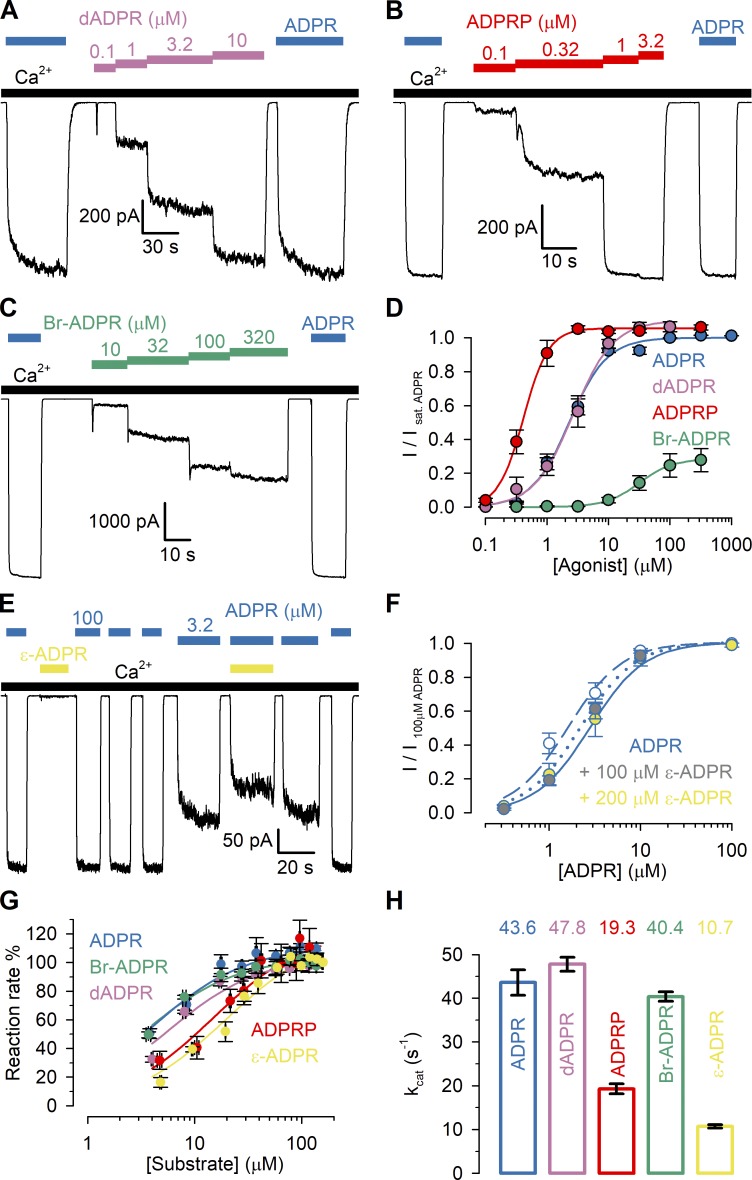
Figure 2.
Apparent affinities of ADPR analogues for nvTRPM2 N- and C-terminal sites. (A–C) Macroscopic nvTRPM2 currents activated by cytosolic exposure to either 100 µM ADPR (dark blue bars) or various concentrations of dADPR (A; purple bars), ADPRP (B; red bars), or Br-ADPR (C; green bars) in the presence of 125 µM Ca2+ (black bars). (D) Steady-state currents in the presence of various test nucleotide concentrations, normalized to the mean of the currents during bracketing exposures of the same patch to 100 µM ADPR, plotted as a function of nucleotide concentration for ADPR (dark blue symbols, replotted from Fig. 1 D), dADPR (purple symbols), ADPRP (red symbols), and Br-ADPR (green symbols). Data represent mean ± SEM from 3 to 32 independent experiments. EC50 values, obtained from fits to the Hill equation (colored lines), are summarized in Table 1 (center column). Maximal fractional activation was 1.1 ± 0.04 for dADPR, 1.06 ± 0.03 for ADPRP, and 0.29 ± 0.01 for Br-ADPR; Hill coefficients were nH = 1.3 ± 0.2 for dADPR, nH = 2.1 ± 0.4 for ADPRP, and nH = 1.6 ± 0.2 for Br-ADPR. (E) Macroscopic nvTRPM2 currents in 3.2 or 100 µM ADPR (dark blue bars), in 200 µM ε-ADPR (first yellow bar), and in 3.2 µM ADPR + 200 µM ε-ADPR (second yellow bar), all in the presence of 125 µM Ca2+ (black bars). (F) Normalized ADPR dose–response curves of nvTRPM2 in the absence of ε-ADPR (blue-white symbols) and in the presence of a fixed concentration of either 100 µM (blue-gray symbols) or 200 µM (blue-yellow symbols) ε-ADPR. For all ADPR concentrations, currents with or without ε-ADPR were obtained within the same patches and normalized to the mean of the currents during bracketing exposures to 100 µM ADPR alone. Data represent mean ± SEM, from 4 to 18 independent experiments. The three dose–response plots were simultaneously fitted (dark blue dashed, dotted, and solid curves) to the equation I/I100ADPR = Îmax × [ADPR]n/(EC50 × (1 + [ε-ADPR]/IC50)n + [ADPR]n), with Îmax, EC50, n, and IC50 as free parameters. This global fit returned parameter estimates Îmax = 1.0 ± 0.0, EC50 = 1.6 ± 0.2 µM (for ADPR), n = 1.5 ± 0.1, and IC50 = 269 ± 91 µM (for ε-ADPR). (G) Rates of nucleotide hydrolysis by the isolated, purified nvNUDT9-H domain as a function of substrate concentration, using ADPR (dark blue symbols; replotted from Iordanov et al., 2019), dADPR (purple symbols), ADPRP (red symbols), Br-ADPR (green symbols), or ε-ADPR (yellow symbols) as the substrate. Reaction rates (mean ± SEM from three to eight independent experiments) were normalized to those observed at the highest substrate concentration. Solid colored lines represent fits to the Michaelis–Menten equation, and obtained Km values are plotted in Table 1 (left column). (H) Molecular turnover numbers (kcat) of isolated, purified nvNUDT9-H for the five substrates in G, measured at saturating substrate concentrations. Data represent mean ± SEM from three to eight independent experiments.

