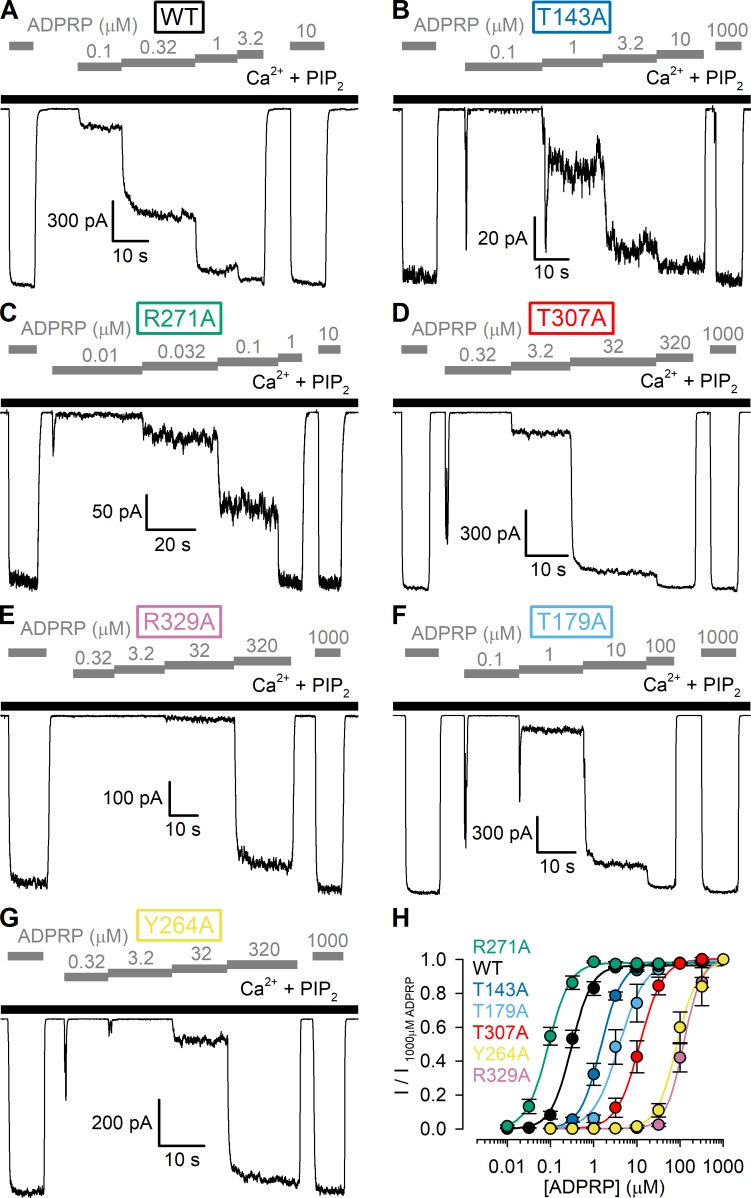
Figure 6.
Apparent affinities for channel activation by ADPRP of WT nvTRPM2 and MHR1/2 domain mutants. (A–G) Macroscopic inside-out patch currents of WT (A), T143A (B), R271A (C), T307A (D), R329A (E), T179A (F), and Y264A (G) nvTRPM2 activated by increasing concentrations of ADPRP (gray bars) in the presence of 125 µM Ca2+ + 2.5 µM PIP2 (black bars). (H) ADPRP dose–response curves of fractional currents, normalized to the mean of the currents observed during bracketing applications of saturating ADPRP in the same patch, for WT and mutant nvTRPM2 channels (color coding follows construct labeling in A–G). Data represent mean ± SEM from 3 to 18 independent experiments. Colored lines are fits to the Hill equation yielding fit parameters EC50 = 0.31 ± 0.02 µM and nH = 1.8 ± 0.2 for WT, EC50 = 1.5 ± 0.1 µM and nH = 1.8 ± 0.1 for T143A, EC50 = 0.089 ± 0.005 µM and nH = 1.7 ± 0.2 for R271A, EC50 = 12 ± 1 µM and nH = 1.6 ± 0.2 for T307A, EC50 = 121 ± 7 µM and nH = 2.1 ± 0.2 for R329A, EC50 = 3.9 ± 0.5 µM and nH = 1.4 ± 0.2 for T179A, and EC50 = 85 ± 8 µM and nH = 1.8 ± 0.3 for Y264A nvTRPM2.

