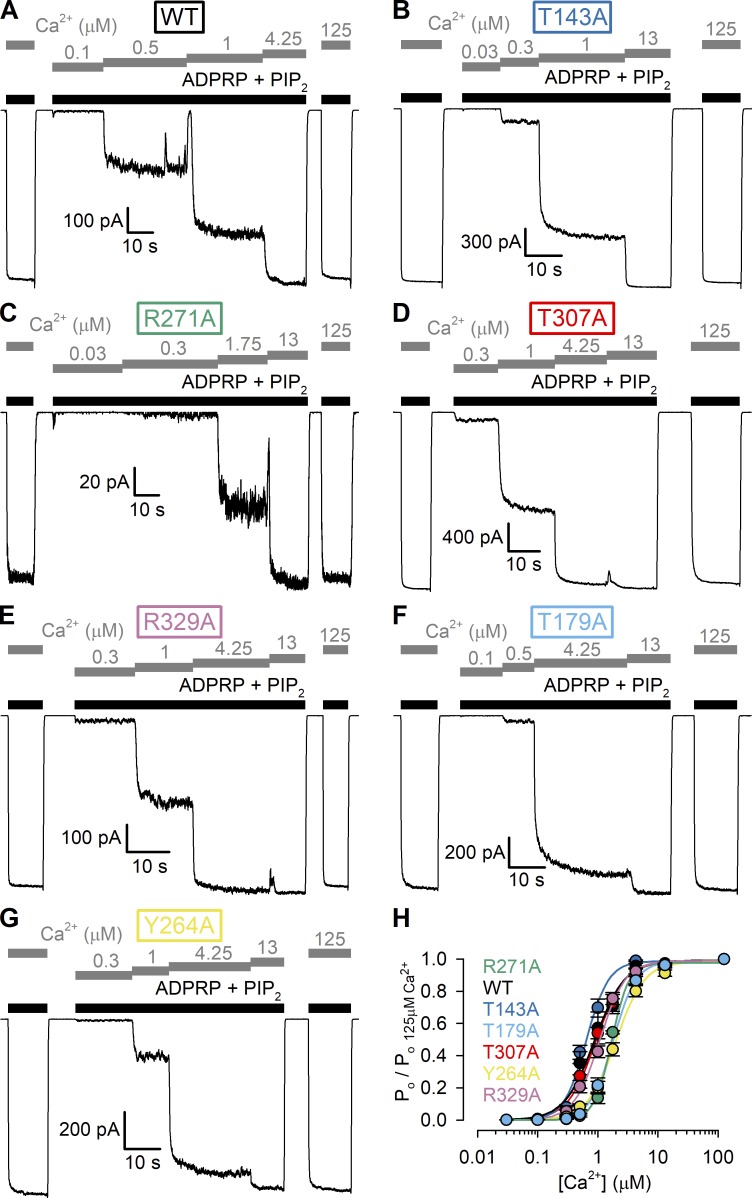
Figure 7.
Apparent affinities for channel activation by Ca2+ of WT nvTRPM2 and MHR1/2 domain mutants. (A–G) Macroscopic inside-out patch currents of WT (A), T143A (B), R271A (C), T307A (D), R329A (E), T179A (F), and Y264A (G) nvTRPM2 activated by increasing concentrations of Ca2+ (gray bars) in the presence of saturating ADPRP + 2.5 µM PIP2 (black bars). [ADPRP] is 10 µM in A and C, 100 µM in B and F, and 1,000 µM in D, E, and G. (H) Ca2+ dose–response curves of fractional Pos, normalized to the mean of the Pos during bracketing applications of 125 µM Ca2+ in the same patch, for WT and mutant nvTRPM2 channels (color coding follows construct labeling in A–G). Fractional Pos (Po/Po;125Ca2+) were obtained by dividing fractional macroscopic current in test [Ca2+] (I/I125Ca2+; Fig. S2 A) by fractional unitary current at the same [Ca2+] (i/i125Ca2+; cf. Fig. S2 B). Data represent mean ± SEM from 5 to 10 independent experiments. Colored lines are fits to the Hill equation yielding fit parameters EC50 = 0.88 ± 0.07 µM and nH = 1.7 ± 0.2 for WT, EC50 = 0.64 ± 0.02 µM and nH = 2.3 ± 0.2 for T143A, EC50 = 1.68 ± 0.04 µM and nH = 3.0 ± 0.2 for R271A, EC50 = 0.93 ± 0.05 µM and nH = 1.9 ± 0.2 for T307A, EC50 = 1.1 ± 0.04 µM and nH = 2.0 ± 0.2 for R329A, EC50 = 1.8 ± 0.1 µM and nH = 2.3 ± 0.1 for T179A, and EC50 = 2.0 ± 0.1 µM and nH = 1.8 ± 0.1 for Y264A nvTRPM2.

