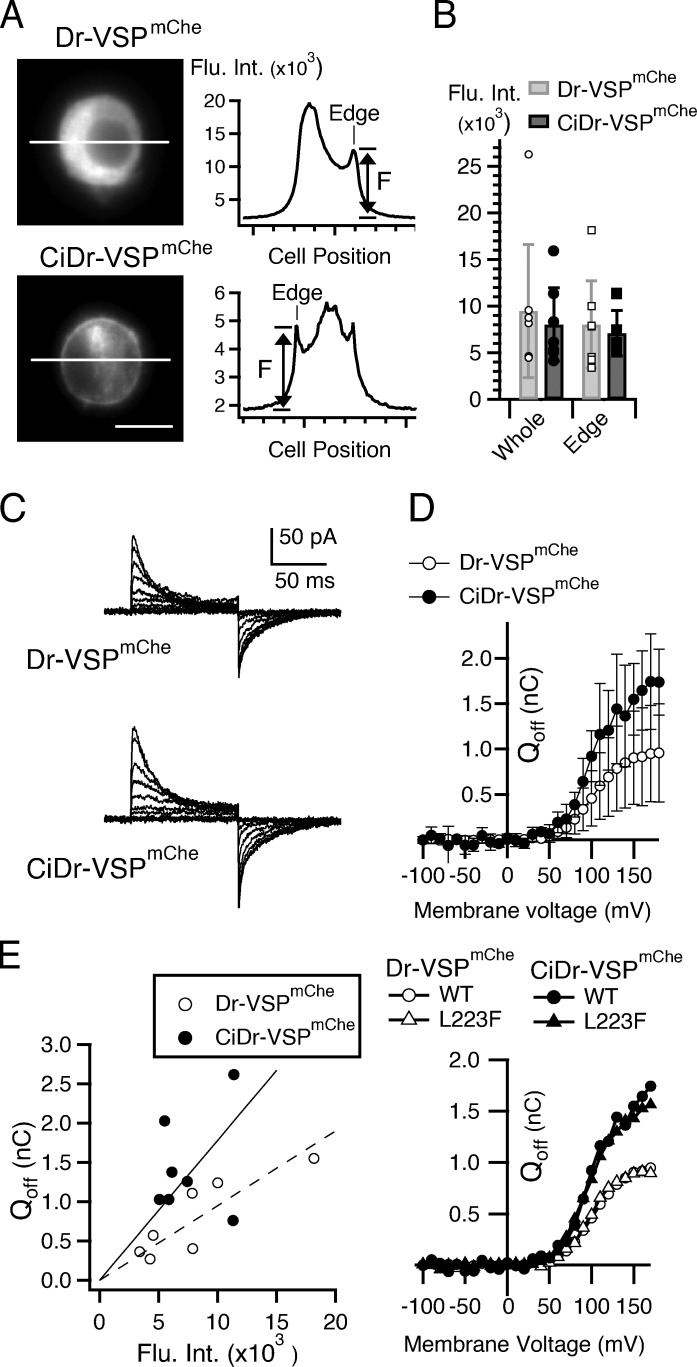
Figure 4.
N-terminal region of Ci-VSP enhanced membrane targeting of Dr-VSP. (A) Representative fluorescence images of cells expressing Dr-VSPmChe (upper) or CiDr-VSPmChe (lower). Fluorescence intensities along the lines drawn through cells are shown in the right graph. Edge in the kymograph indicates the cell contour, and its fluorescence intensity was indicated by “F.” Scale bar, 10 µm. (B) Average fluorescence intensity over the whole cell area and the peak intensity in cell contour (edge) estimated from images of Dr-VSPmChe and CiDr-VSPmChe fluorescence. Data are the mean ± SD from seven cells and each symbol shows the data from one cell. (C) Representative traces of sensing current that were measured using the solution specific for sensing current measurement. The currents were measured by applying depolarizing step pulses (−100 mV to 170 mV in 10-mV increments) from the holding potential (−60 mV) with the P/−4 method, though the traces shown are in 20-mV increments. (D) Top: Q-V relationships of Dr-VSPmChe and CiDr-VSPmChe. The charge movements in the repolarization step (Qoff) were estimated by integration of the Qoff. Unfilled and filled circles represent Dr-VSPmChe and CiDr-VSPmChe, respectively. Error bars indicate the SD (Dr-VSPmChe: n = 7 [−100 to ∼170 mV], CiDr-VSPmChe: n = 7, 6, 4, 3 [−100 to ∼130, 140, 150, and 160 to ∼170 mV]). Datasets of Dr-VSPmChe and CiDr-VSPmChe (70 to ∼130 mV) were compared with repeated-measures two-way ANOVA. There was a significant difference between these two groups (P = 0.05). Bottom: Q-V relationships of Dr-VSPmChe WT, L223F, CiDr-VSPmChe WT, and L223F (Dr-VSPmChe WT and CiDr-VSPmChe WT are equal to Dr-VSPmChe and CiDr-VSPmChe in other panels, respectively). Error bars were not shown to make averaged values easier to see. Parameters of these Q-V curves were shown in Table 1. (E) Relationship between the Qoff and the fluorescence intensity in the cell contour. In this Qoff, we chose the value of Qoff measured at the holding potential after depolarizing at 130 mV, since recordings at more than 140 mV were often unsuccessful due to unstable cell membrane. Each point shows a value from one cell and fitted by linear function (slope, 1.78 × 10⁻⁴ in Dr-VSPmChe; 0.95 × 10⁻⁴ in CiDr-VSPmChe).

