
Figure 3: Imaging of fluorescent cells in atherosclerotic plaques.
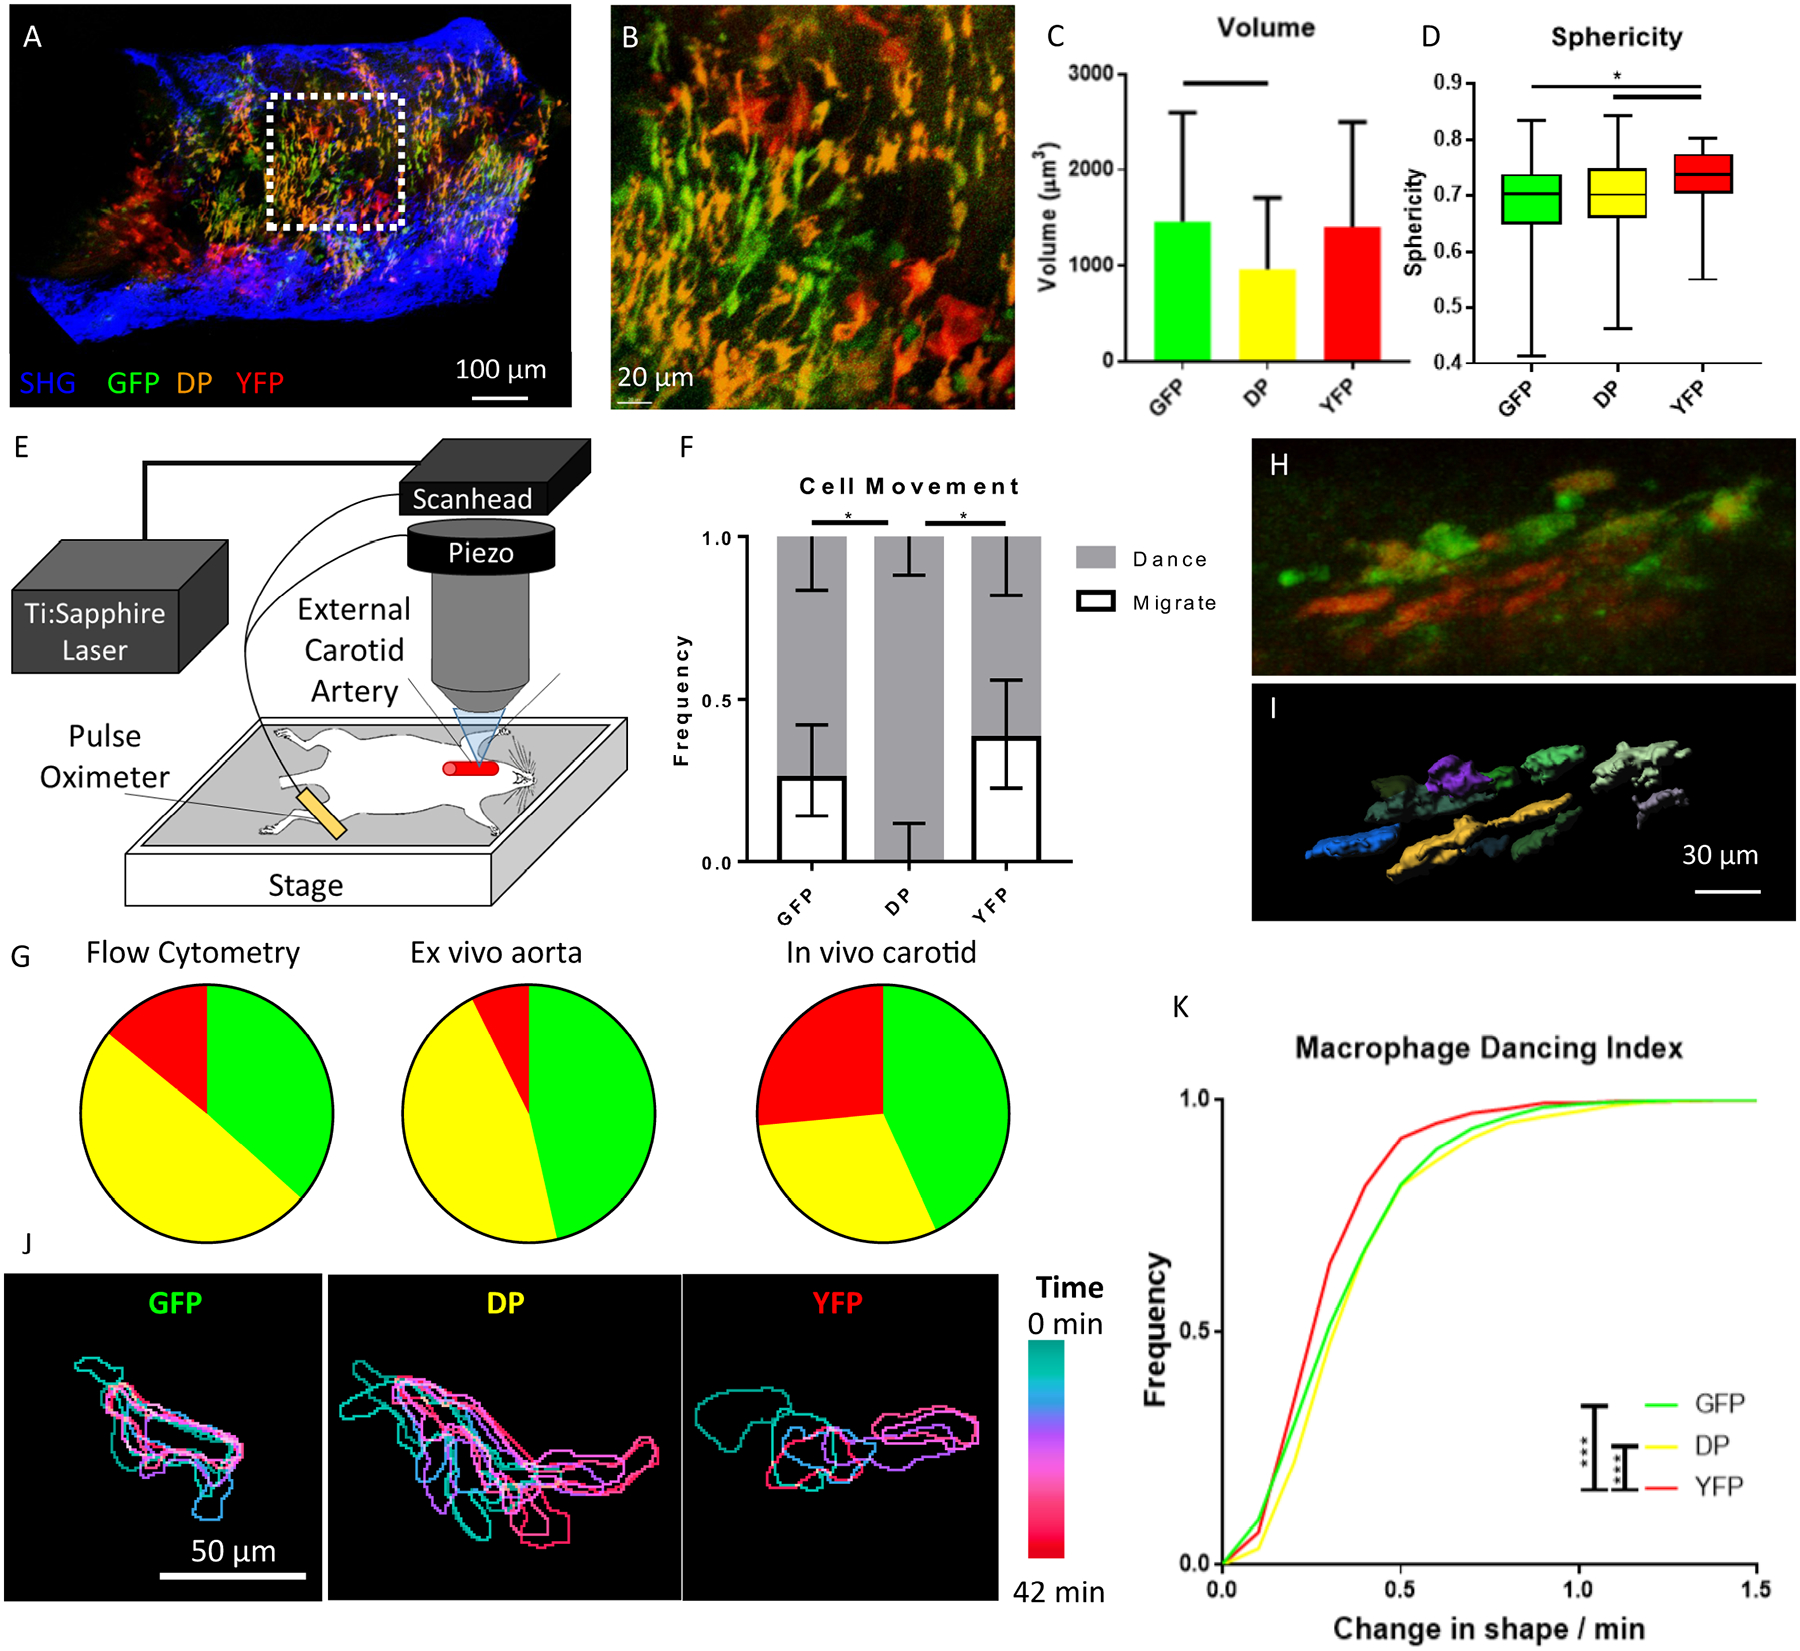
A) An aorta explanted from an Apoe−/− Cx3cr1GFP/+CD11cYFP mouse fed WD and imaged with two-photon microscopy shows GFP, DP, and YFP cells in the wall. B) Zoom-in on the white dotted box, showing details of the shape and cell-cell contact of macrophages in the atherosclerotic arterial wall. C) Volume and D) Sphericity of the 3 subsets of cells in the ex vivo aorta. Mean ± SD of n=187, 186, and 30 cells, respectively. Bars indicate p<.05 by the Kruskal-Wallis non-parametric test with Dunn’s correction for multiple comparisons. E) Equipment setup for intravital imaging of the carotid artery, adapted from25. F) Qualitative assessment of cell motion of the 3 visible phenotypes by a blinded judge. 95% confidence intervals were calculated using the Wilson/Brown method. * indicates the confidence intervals on the Migrate group do not overlap. G) The fraction of the GFP, DP, and YFP populations among all fluorescent cells in the aorta by flow cytometry (left), in the imaged aortic explants (middle), and among all moving cells in the intravital carotid artery movies (right). H) Representative maximum intensity projection of an image acquired via intravital imaging of the carotid artery of an Apoe−/− Cx3cr1GFP/+CD11cYFP mouse fed WD. See Online Videos I–II for more examples. I) Imaris surface rendering of cells from H. Each cell is shown in a different color to emphasize boundaries. J) Example movement of a representative GFP, DP, and YFP cell, demonstrating types of motion. The position of each cell in 7 different time points (7 min apart) was overlaid. Each color represents a different time point; ILTIS intravital microscopy. K) Cumulative frequency distributions of macrophage “dancing” motion in the carotid artery in vivo for each fluorescent group. A total of n=439 (GFP), 764 (DP), and 837 (YFP) cell motions were detected, where each point quantifies the change in each cell (normalized to cell size) between 2 successive time points. Distribution differences tested by Kolmogorov-Smirnov test. * p<.05; *** p<.0001