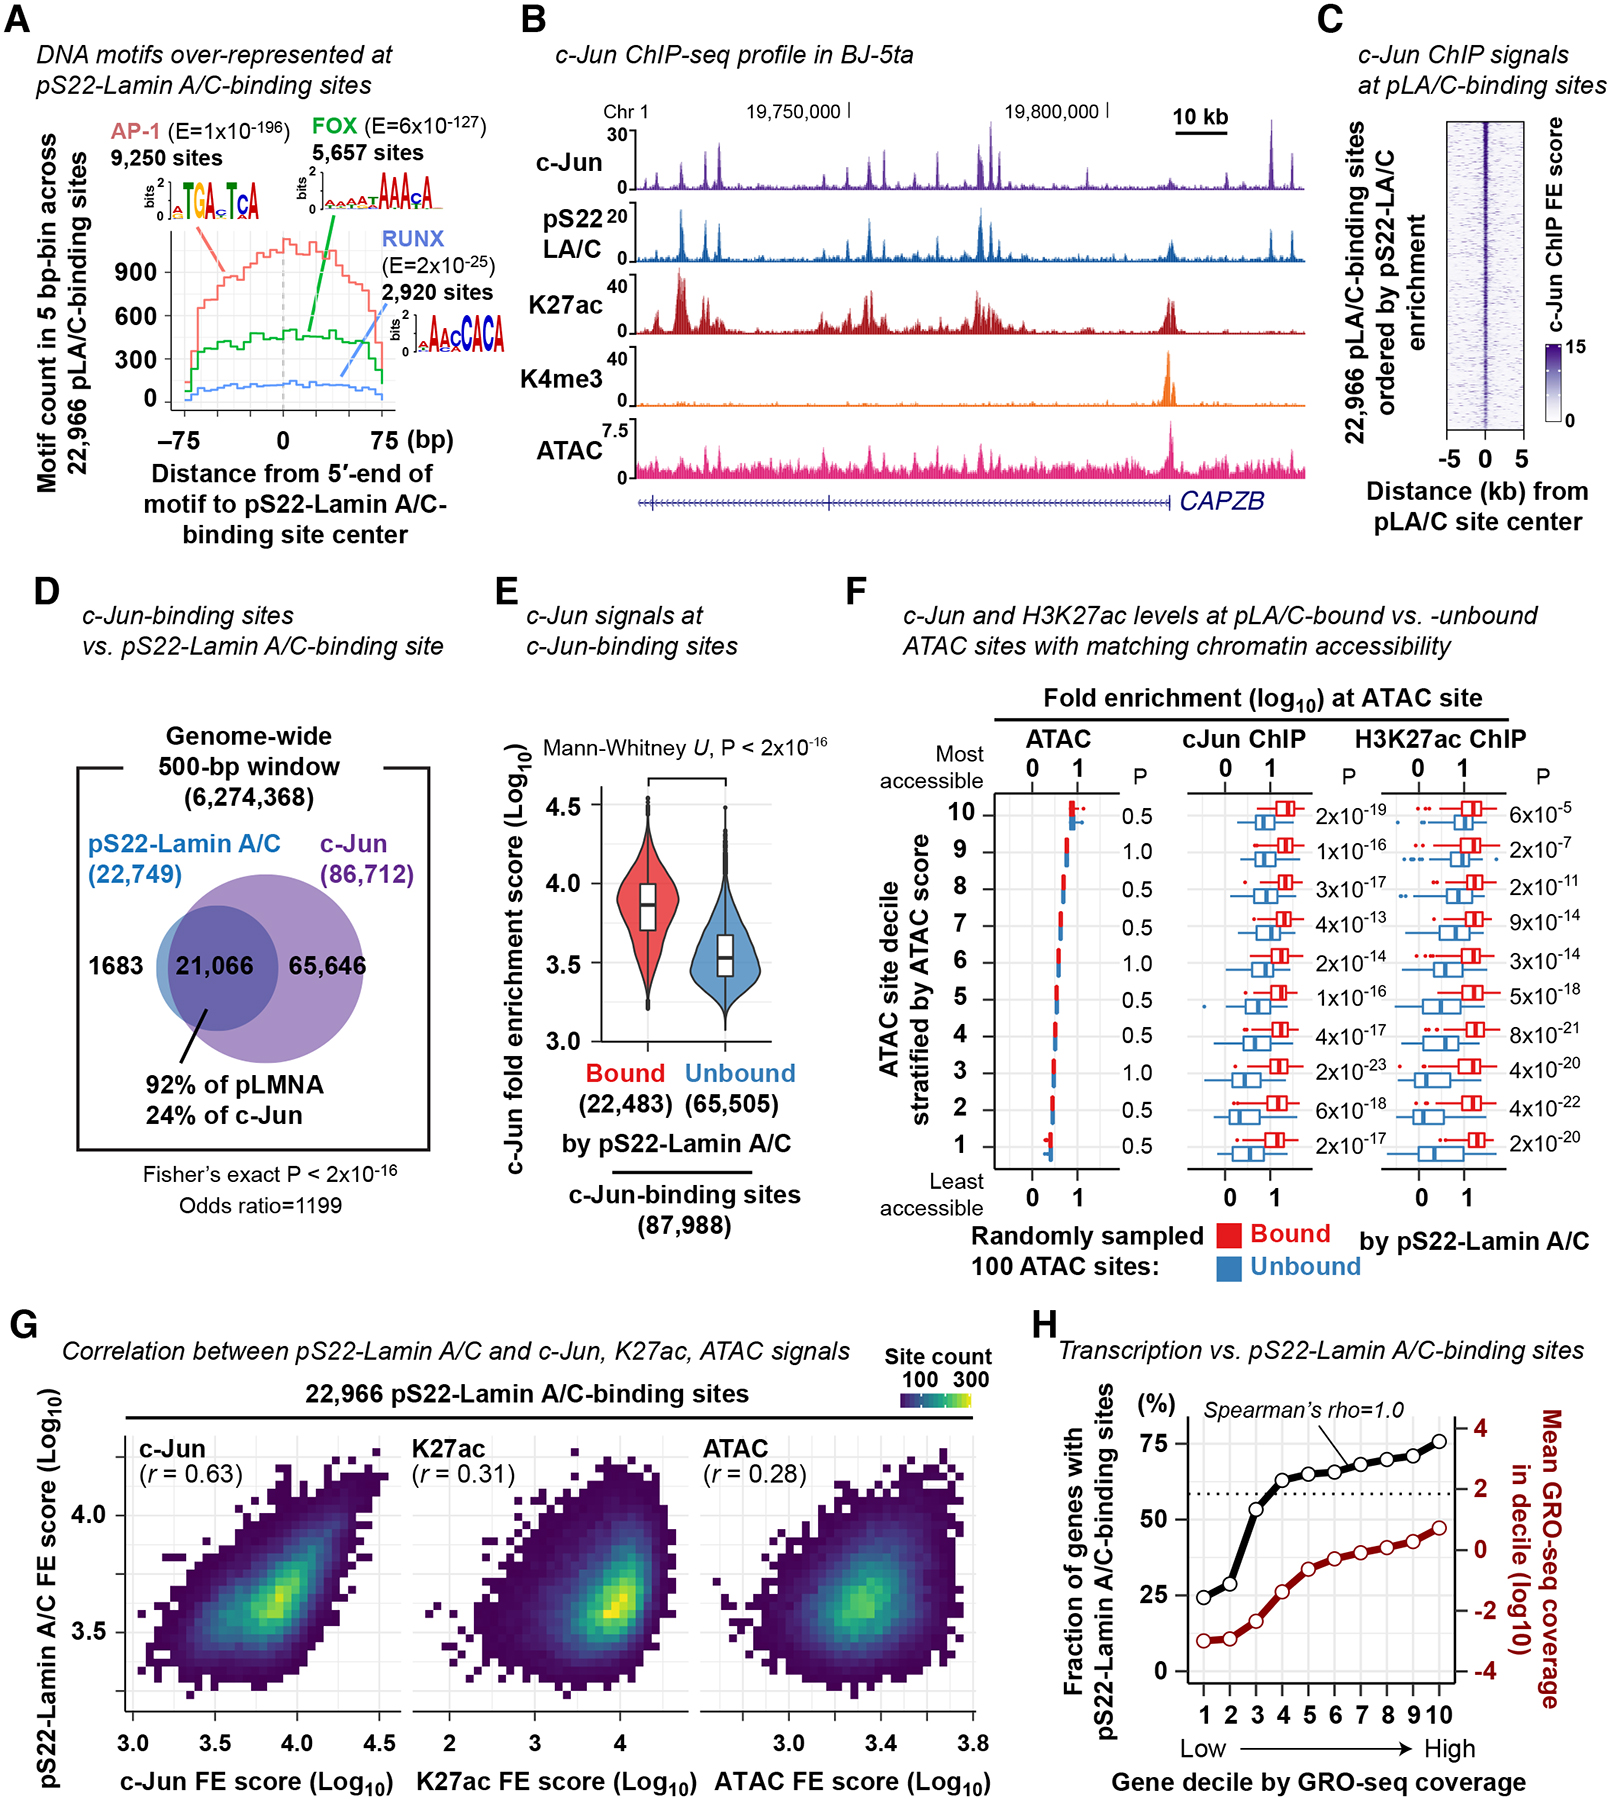
Figure 3. pS22-Lamin A/C association and c-Jun association are strongly correlated at pS22-Lamin A/C-binding sites.

(A) DNA motif frequency at pS22-Lamin A/C-binding sites. E, motif occurrence probability score in de novo DNA motif search.
(B) Representative c-Jun ChIP-seq FE profile in BJ-5ta cells (derived from 3 biological replicates). Other profiles are shown for comparison.
(C) c-Jun ChIP-seq FE scores at pS22-Lamin A/C-binding sites.
(D) Overlap between pS22-Lamin A/C-binding sites and c-Jun-binding sites. Numbers indicate the number of 500-bp windows that overlap pS22-Lamin A/C-binding sites and/or c-Jun-binding sites.
(E) c-Jun ChIP FE scores at c-Jun-binding sites bound or unbound by pS22-Lamin A/C. Box, interquartile range. Violin, kernel density (see Methods).
(F) c-Jun ChIP and H3K27ac ChIP-seq FE scores at 100 pS22-Lamin A/C-bound and 100 unbound ATAC sites. The analyzed 100 sites were randomly selected from each decile of all ATAC sites stratified by accessibility. Mann-Whitney U-test compares FE scores between pS22-Lamin A/C-bound and -unbound sites, and P-values are adjusted for multiple comparisons by the Benjamini-Hochberg method. See also Fig. S3.
(G) Two-dimensional histogram of pS22-Lamin A/C-binding sites by ChIP-seq and ATAC-seq FE scores. One square, one bin, with color grade representing the number of sites. r, Pearson correlation coefficient.
(H) Black line, fraction of genes harboring pS22-Lamin A/C-binding sites within gene body or 100 kb upstream. Genes are stratified by the transcription levels defined by GRO-seq read coverage. Red line, mean GRO-seq coverage in gene decile. Horizontal dotted line, fraction of all genes harboring pS22-Lamin A/C-binding sites for reference. GRO-seq was performed in BJ-5ta in 2 biological replicates.
