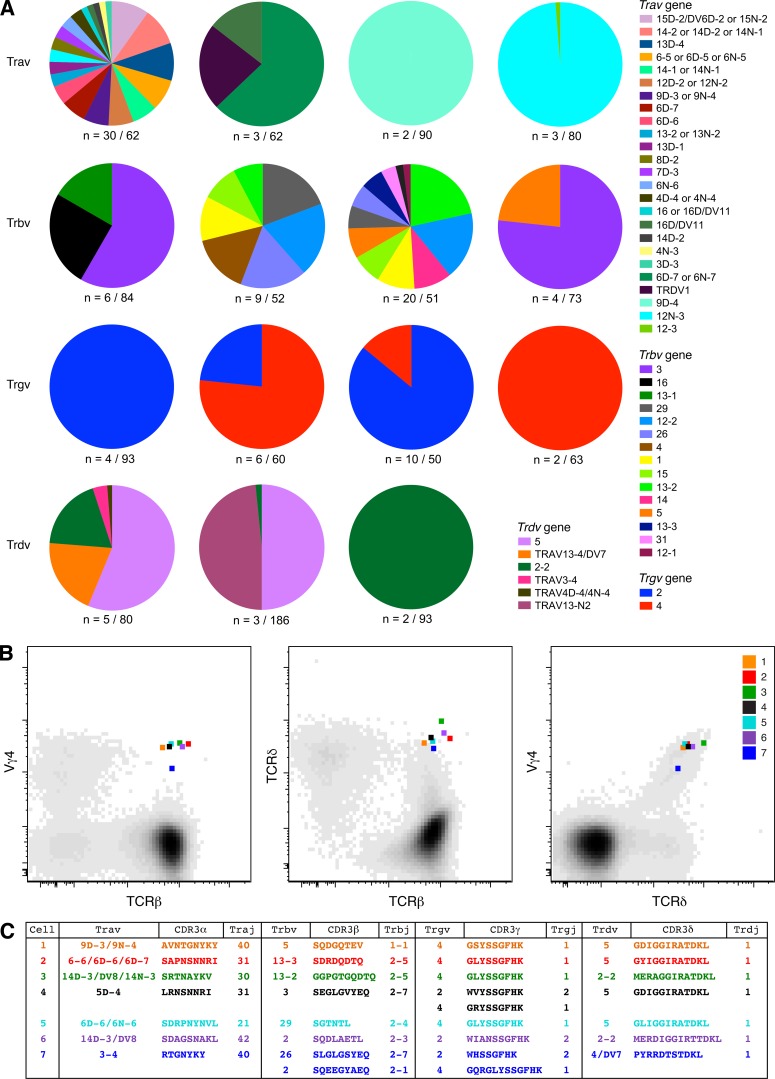
Figure 2.
Molecular analysis of TCR expression in flow-purified Vγ4+TCRβ+ cells. Viable CD3+Vγ4+TCRβ+ cells were flow purified from WT mice. (A) Pie charts display relative population-level frequencies for the Trav, Trbv, Trgv, and Trdv genes depicted in the key (IMGT nomenclature), with the total number of sequences indicated below. Concatenated data are shown (n = 4 mice). (B) Flow cytometry plots showing index-sorted Vγ4+TCRδ+TCRβ+ cells superimposed on cloud plots depicting the overall distribution of Vγ4 versus TCRβ (left panel), TCRδ versus TCRβ (middle panel), and Vγ4 versus TCRδ (right panel) in one mouse with EAE. (C) TCR sequences amplified from the single cells shown in B. Cells and sequences are color matched in B and C.

