Figure 5.
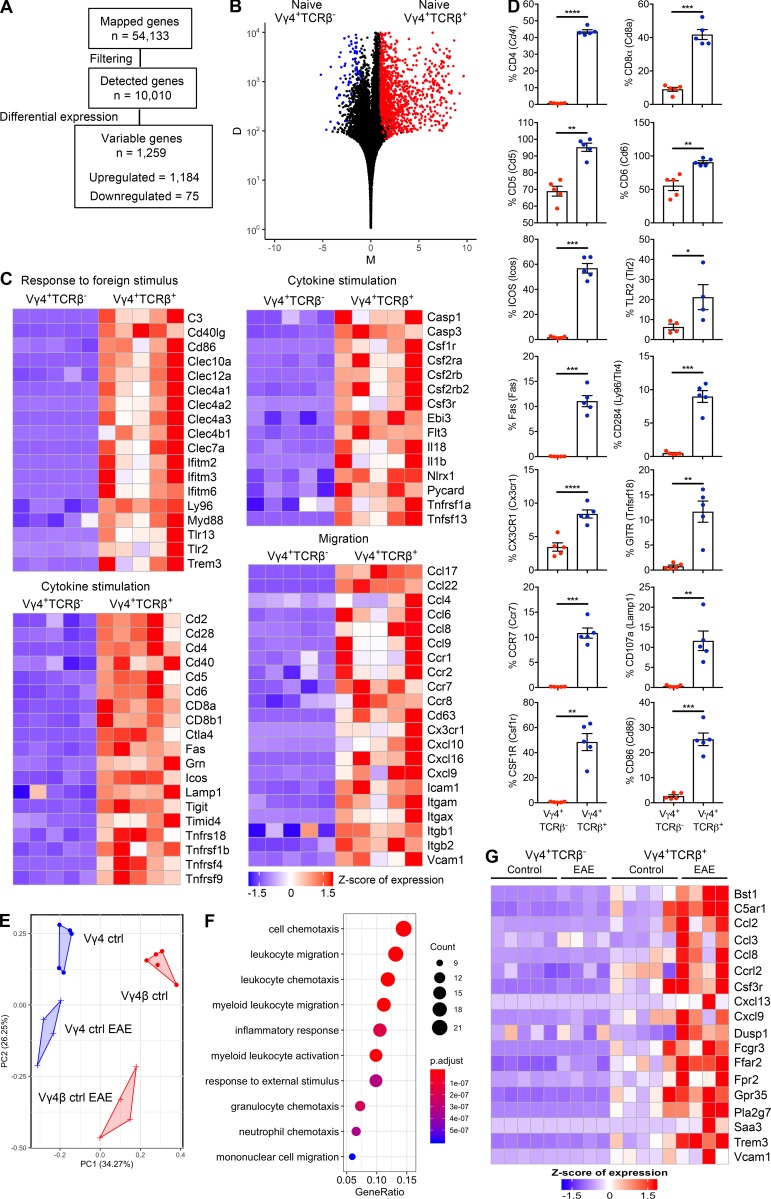
Hybrid αβ-γδ T cells are transcriptionally distinct from conventional γδ T cells. RNA sequencing analysis of Vγ4+TCRδ+TCRβ+ (Vγ4+TCRβ+) or Vγ4+TCRδ+TCRβ− (Vγ4+TCRβ−) cells flow sorted from the spleens and LNs of naive WT mice or WT mice on day 3 of EAE. (A) Summary of the data preprocessing and filtering workflow. (B) NOISeq MD plot of genes passing the low-level filtering cutoff (n = 10,010), highlighting DEGs (n = 1,259) between naive Vγ4+TCRβ+ and Vγ4+TCRβ– cells. Red dots: genes up-regulated in Vγ4+TCRβ+ cells (n = 1,184). Blue dots: genes down-regulated genes in Vγ4+TCRβ+ cells (n = 75). M represents the log2-fold change in normalized expression values between Vγ4+TCRβ+ and Vγ4+TCRβ− cells. D represents the absolute value of the difference in expression between Vγ4+TCRβ+ and Vγ4+TCRβ− cells. D values are displayed on a log10 scale. Increasing D values represent increasing differences in expression levels between Vγ4+TCRβ+ and Vγ4+TCRβ− cells. (C) Heatmaps of selected genes from enriched biological processes derived using gene ontology enrichment analysis of up-regulated genes between naive Vγ4+TCRβ+ and Vγ4+TCRβ− cells. Expression values were z-transformed for visualization. (D) Flow cytometric analysis of purified CD3+ cells, comparing naive Vγ4+TCRβ+ and Vγ4+TCRβ− cells, gated on live CD3+TCRδ+ cells. Results are shown as mean ± SEM. (E) Reduced dimensionality representation of four cell populations via a principal-component analysis plot, where the Vγ4+TCRβ+ and Vγ4+TCRβ− populations separate along the first principal component (PC1) and the equivalent populations in naive mice or mice with EAE separate along the second principal component (PC2). (F) Dot plot of the top 10 significantly enriched biological processes inferred from differentially up-regulated genes in Vγ4+TCRβ+ or Vγ4+TCRβ− cells from mice with EAE versus naive mice (cluster 1 in Fig. S3 C; n = 158 genes). Dot color represents the P-adjusted enrichment value, and dot size represents the number of genes within each enriched gene ontology. (G) Heatmap of genes associated with chemotaxis/migration among all four populations derived using the gene ontology enrichment analysis in F. Expression values were z-transformed for visualization. Most of the data are shown for individual mice (n = 4 or 5 mice per group), except in D, where the data are representative of two experiments (n = 5 mice). *, P < 0.05, **, P < 0.01, ***, P < 0.001, ****, P < 0.0001; unpaired t test.

