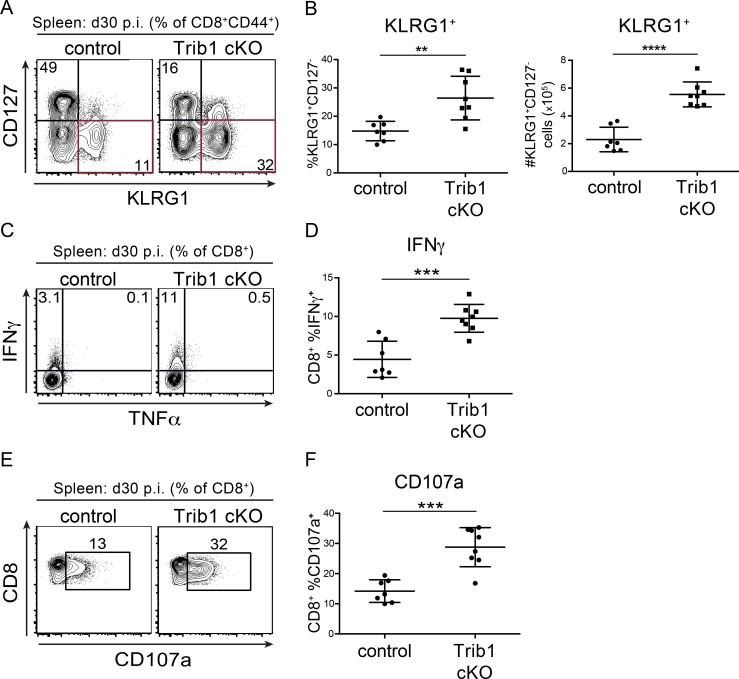
Figure 4.
Trib1 cKO mice sustain elevated CD8 effector-like T cells and function during chronic infection. (A and B) Representative flow plots (A) and summary of the frequency (left) and absolute number (right) of splenic CD8 effector-like T cells (KLRG1+CD127−, gated on CD8+ CD44+) at day 30 after clone 13 infection (B). (C and D) Representative flow plots (C) and summary of cytokine production measured by frequency of cytokine-producing cells in splenic CD8 T cells harvested from mice at day 30 p.i. and stimulated ex vivo as in Fig. 3, C–F (D). (E and F) Representative flow plots (E) and summary of CD107a staining on splenic CD8 T cells harvested from mice at day 30 p.i. and stimulated ex vivo as in C and D (F). Data in A and B are representative of four independent experiments each with 8–10 mice per genotype. Data in C–F are representative of three or four independent experiments each with 6–10 mice per genotype. Error bars are mean ± SD. **, P < 0.01; ***, P < 0.001; ****, P < 0.0001 by unpaired Student’s t test. Control: CD4-cre+ Trib1+/+; Trib1 cKO: CD4-cre+ Trib1F/F.

