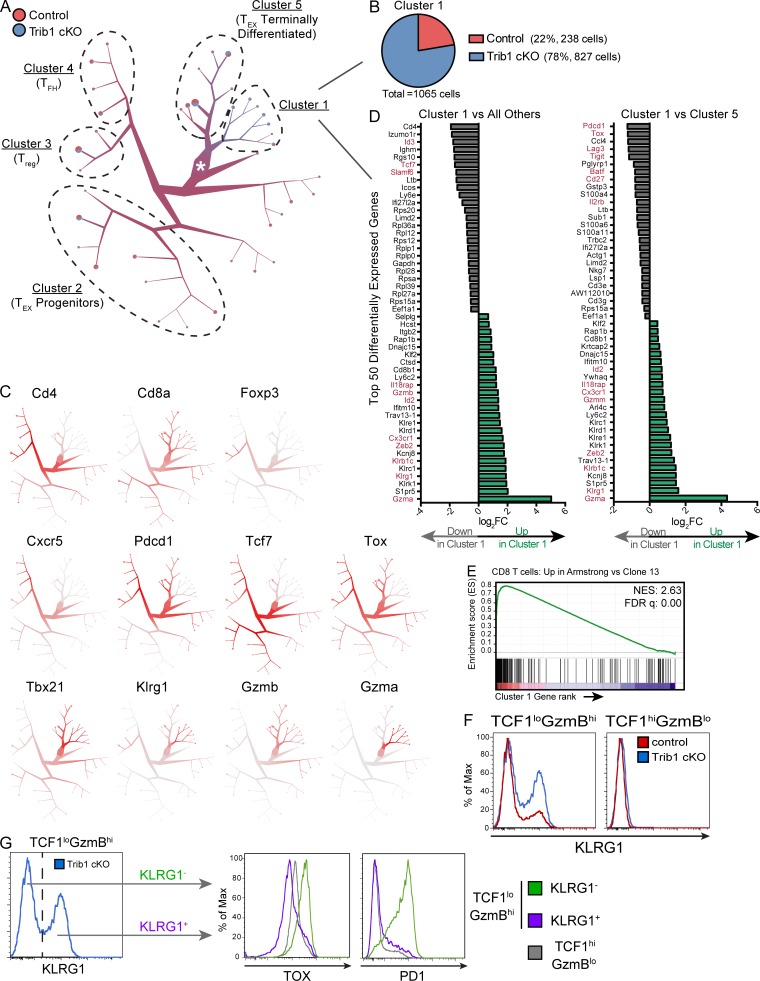
Figure 6.
scRNA-seq analysis reveals a KLRG1+ effector population that is transcriptionally distinct from TEX subsets and is enriched in the absence of Trib1. Activated T cells (TCRβ+CD44+) were isolated by FACS from spleens of either control or Trib1 cKO mice at day 15 after clone 13 infection and prepared for scRNA-seq analyses. (A) Visualization of single-cell clustering using TooManyCells from 7,611 TCRβ+CD44+ cells. All cells begin at the central node (white star) and are recursively bipartitioned based on transcriptional similarity. To this end, TooManyCells produces a hierarchy of nested cell clusters where each inner node is a cluster at a given resolution and a leaf node is a finer-grain cluster where any additional bipartitioning would be as good as randomly bipartitioning the cells. Branches connect similar groups of cells and their width and color correspond to the number and mixed annotation of cells within the connected clusters, respectively. Terminal branches contain pie charts delineating the fraction of cells from either control or Trib1 cKO in each terminal branch. Clusters of interest and clusters with predominance of known T cell populations based on expression of known markers are denoted. (B) Number and composition of cells in Cluster 1. (C) Normalized gene expression per cell (red = higher expression, gray = lower expression). (D) Top 50 differentially expressed genes in Cluster 1 vs. all other cells (left) or Cluster 1 vs. Cluster 5 (right). Red genes denote genes associated with effector, terminal TEX, or progenitor TEX cells. FC, fold-change. (E) GSEA of the transcriptional signature associated with CD8 T cells from Armstrong vs. cl13 infection (GSE30962) compared with the differentially expressed genes in Cluster 1 vs. all other cells. NES, normalized enrichment score; FDR, false discovery rate. (F) Representative histograms of KLRG1 expression in TCF1loGzmBhi and TCF1hiGzmBlo CD8 T cells (gated on CD8+CD44+ and applicable TCF1/GzmB gating as defined in Fig. 5) from the spleens of control or Trib1 cKO mice at day 30 after clone 13 infection measured by flow cytometry. (G) Gating strategy (left) of KLRG1+ and KLRG1− cells from TCF1loGzmBhi CD8 T cells in Trib1 cKO mice at day 30 p.i. (same cells as presented in panel F, left, blue) for analysis of TOX and PD1 expression within each of these subsets (right). Expression of TOX and PD1 on TCF1hiGzmBlo cells from the same Trib1 cKO mouse are shown in gray for comparison. scRNA-seq data are representative of two biologically independent pooled samples per genotype. Data in F and G are representative of an experiment with six to eight mice per genotype. Control: CD4-cre+Trib1+/+; Trib1 cKO: CD4-cre+Trib1F/F.

