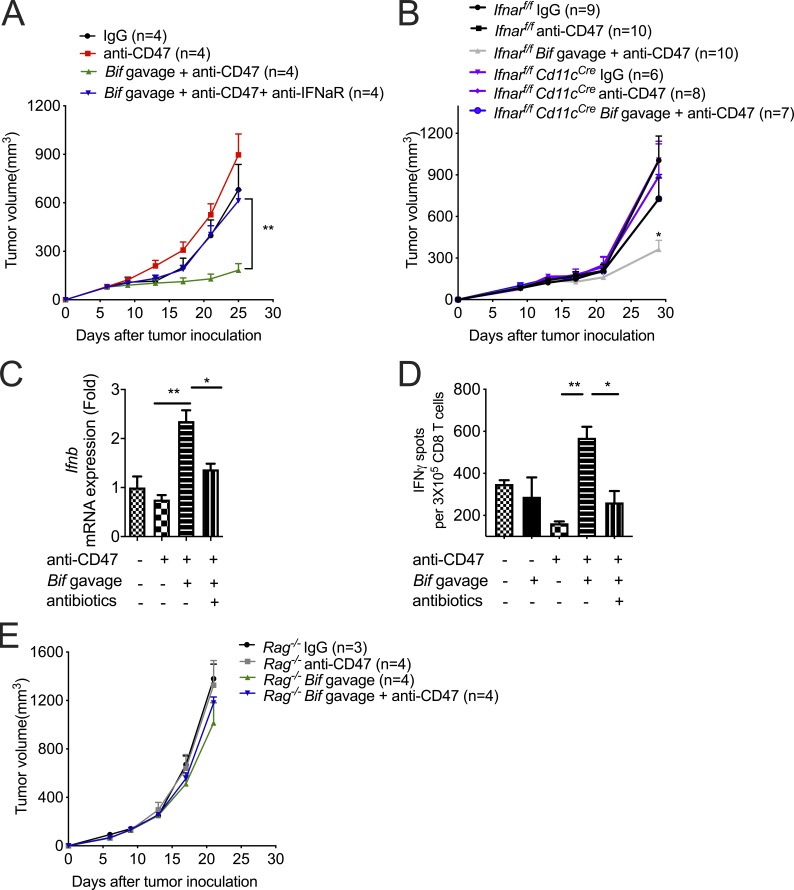
Figure 3.
I.t. type I IFN signaling and T cells are essential for Bifidobacterium-mediated tumor control. (A and B) MC38 tumor–bearing TAC mice (A) and Ifnarf/f or Ifnarf/fCd11cCre mice (B) were i.t. injected with 70 µg CD47 antibody or 70 µg rat IgG on days 9 and 13. For gavage of Bifidobacterium, mice were gavaged with 5 × 10⁸ Bifidobacterium on days 6, 9, and 13. Tumor volume was measured at the indicated time points. (A) To block type I IFN signaling, mice were i.t. injected with 200 µg anti-IFNAR or rat IgG on days 6, 8, 10, 12, and 14. The Bif gavage + anti-CD47 group is compared with the Bif gavage + anti-CD47 + anti-IFNaR group. (B) The Ifnarf/fCd11cCre Bif gavage + anti-CD47 group is compared with the Ifnarf/f Bif gavage + anti-CD47 group. (C) qPCR of Ifnb1 mRNA levels in tumor-infiltrating DCs. MC38 tumors of TAC mice were injected with 70 µg CD47 antibody or 70 µg rat IgG on day 9. Mouse tumors were injected with 100 µl antibiotic cocktail solution or PBS every other day. For gavage of Bifidobacterium, mice were gavaged with 5 × 10⁸ CFU Bifidobacterium on days 6 and 9, respectively. On day 13, tumor tissues were collected for flow cytometric sorting of tumor-infiltrating DCs. Ifnb1 mRNA levels were quantified by qPCR. (D) Number of ELISPOT IFNγ spots of 3 × 10⁵ sorted OTI-TCR CD8+ T Cells cocultured with DCs from tumor tissues in Tac mice. Tac mice were subcutaneously injected with 2 × 10⁶ MC38-OTI tumor cells and i.t. injected with 70 µg CD47 antibody or 70 µg rat IgG on days 9 and 12. Mice were i.t. injected with 100 µl antibiotic cocktail solution or PBS every other day from day 6. 2 d after the final injection of antibody, tumor tissues were collected for tumor DC sorting. For gavage of Bifidobacterium, mice were gavaged with 5 × 10⁸ CFU Bifidobacterium on days 6, 9, and 12. (E) MC38 tumors of Rag−/− mice were injected with 70 µg CD47 antibody or 70 µg rat IgG on days 9 and 13. For gavage of Bifidobacterium, mice were gavaged with 5 × 10⁸ CFU Bifidobacterium on days 6, 9, and 13. Tumor volume was measured at the indicated time points. One representative experiment from at least two experiments yielding similar results is depicted in A, C, D, and E, and each group contains four mice (A and E). The results in B were based on data pooled from two independent experiments yielding similar results, and each group contains at least six mice. Presented as mean ± SEM. **, P < 0.01 (two-way ANOVA; A and E). *, P < 0.05; **, P < 0.01 (nonpaired Student’s t test; B, C, and D).

