Figure 1.
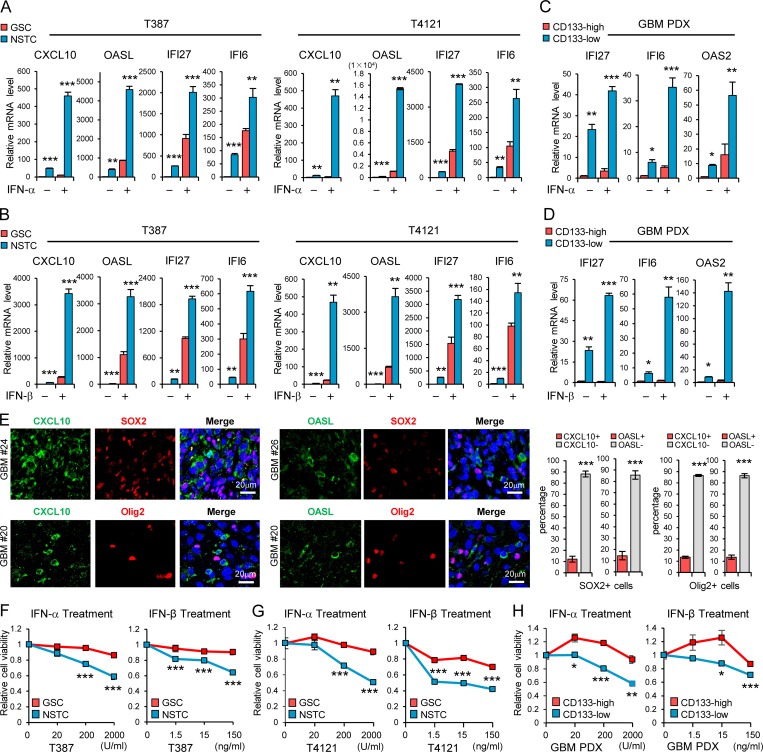
GSCs display less sensitivity to type I IFN suppression. (A and B) GSCs and matched NSTCs (T387 and T4121) were treated with IFN-α (200 U/ml; A, n = 3) or IFN-β (15 ng/ml; B, n = 3) for 12 h. The mRNA levels of IRGs CXCL10, OASL, IFI27, and IFI6 were analyzed by real-time qPCR. (C and D) CD133high and CD133low glioma cells isolated from GBM PDX were treated with IFN-α (200 U/ml; C, n = 3–4) or IFN-β (15 ng/ml; D, n = 3–4) for 12 h. The mRNA levels of IRGs IFI27, IFI6 and OAS2 were analyzed by real-time qPCR. Data were normalized to untreated GSC group that was set to 1. The y axis represents fold changes (A–D). (E) Co-IF staining of CXCL10 or OASL (green) and putative stem cell markers (SOX2 or Olig2, red) in human GBM specimens. Nuclei were counterstained with Hoechst (blue). Representative images are shown (left). Quantifications are shown (right, n = 3). (F–H) T387 GSCs (F, n = 3) or T4121 GSCs (G, n = 3) and the matched NSTCs, or the CD133high/CD133low glioma cells isolated from GBM PDX (H, n = 4), were treated with indicated dose of IFN-α or IFN-β for 3 d. Cell viability was assessed at day 3 and normalized to the untreated control. Data are represented as mean ± SD (A, B, and E–G) or mean ± SEM (C, D, and H). *, P < 0.05; **, P < 0.01; ***, P < 0.001, as assayed by unpaired Student’s t test or Welch’s t test.

