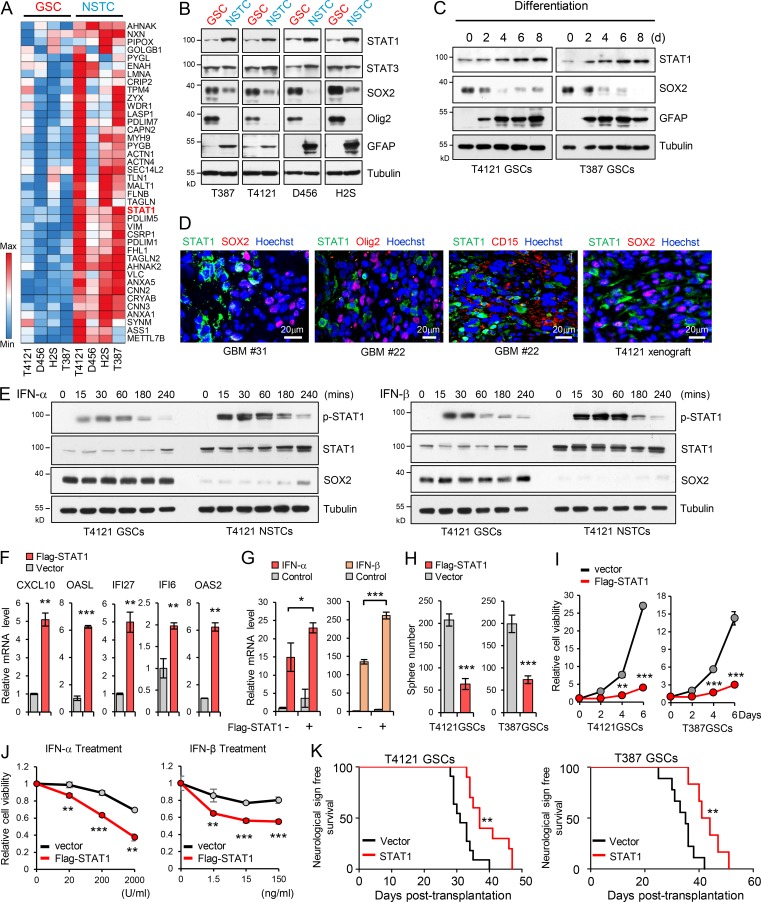
Figure 2.
Low STAT1 expression is associated with GSC proliferation and tumorigenicity. (A) Heatmap representation of the 40 upregulated proteins (average change more than twofold) screened by MS in four NSTCs compared with matched GSCs derived from human GBM tumors. Raw data were log2 transformed. A relative color scheme uses the minimum and maximum values in each row to convert values to colors. Red is high expression and blue is low. (B) Immunoblot (IB) analysis of STAT1, STAT3, SOX2, Olig2, and GFAP (astrocyte marker) in four GSCs and matched NSTCs. (C) IB analysis of STAT1, SOX2, and GFAP during GSC differentiation induced by serum (10% FBS). (D) Co-IF staining of STAT1 (green) and SOX2, Olig2, and CD15 (red) in human GBM specimens and mouse GBM orthotopic xenografts. Nuclei were counterstained with Hoechst (blue). (E) GSCs and matched NSTCs (T4121) were treated with IFN-α (200 U/ml) or IFN-β (15 ng/ml) for indicated times. Phosphorylated-STAT1, STAT1, SOX2, and tubulin were examined by IB analysis. (F and G) Flag-vector or Flag-STAT1–overexpressing GSCs (T4121) were untreated (F, n = 3) or treated with IFN-α (200 U/ml) or IFN-β (15 ng/ml; G, n = 3) for 12 h. mRNA levels of indicated genes were analyzed by real-time qPCR. Data were normalized to untreated GSC group that was set to 1. The y axis represents fold changes. Unpaired Student’s t test or Welch’s t test. (H and I) Overexpression of Flag-STAT1 impaired sphere formation of GSCs (H) and inhibited cell viability of GSCs (I). Quantification of sphere number (per 2,000 cells) formed by GSCs are shown (H, n = 3). Cell viability of GSCs was assessed at indicated time and normalized to day 0 in each group (I, n = 3). Unpaired Student’s t test. (J) T4121 GSCs expressing vector or Flag-STAT1 were treated with indicated dose of IFN-α (n = 3) or IFN-β (n = 5) for 3 d. Cell viability was assessed and normalized to the untreated control. Unpaired Student’s t test. (K) GSCs expressing vector or Flag-STAT1 were transplanted into brains of nude mice (2 × 10⁴ cells/mouse, nu/nu nude mice). Kaplan–Meier survival curves of mice implanted with T4121 GSCs (vector, n = 11; Flag-STAT1, n = 10; left) or T387 GSCs (vector, n = 9; Flag-STAT1, n = 6; right) are shown. Log-rank test. Data are represented as mean ± SD. *, P < 0.05; **, P < 0.01; ***, P < 0.001.

