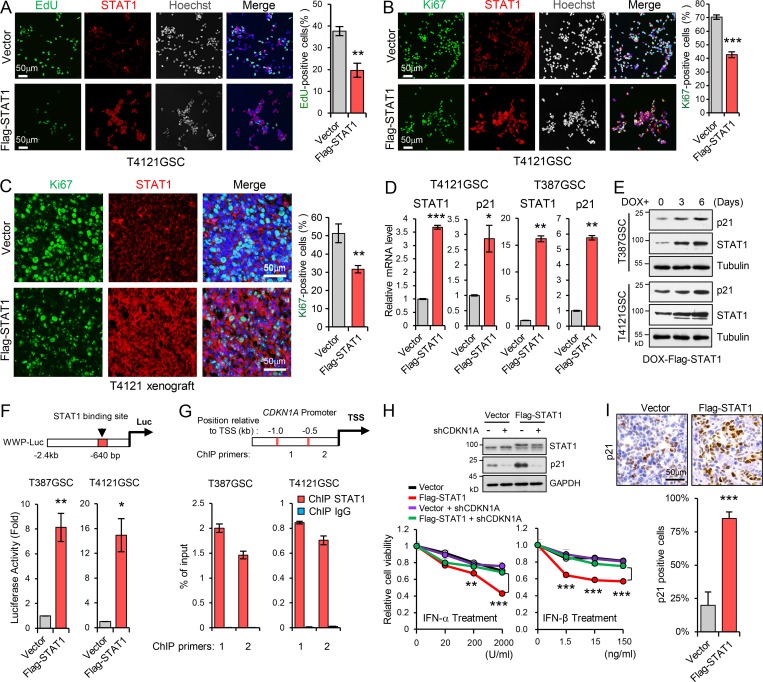
Figure 3.
Low STAT1 expression is essential for GSC proliferation through p21 regulation. (A and B) Overexpression of Flag-STAT1 inhibited GSC proliferation. EdU incorporation assay (A, n = 3) and Ki67 staining (B, n = 3) in T4121 GSCs expressing vector or Flag-STAT1. Representative images are shown (left). The percentage of EdU+ or Ki67+ cells was quantified (right). (C) Co-IF staining of Ki67 (green) and STAT1 (red) in GBM xenografts derived from T4121 GSCs expressing vector or Flag-STAT1 (left). The percentage of Ki67+ cells was quantified (n = 3, right). (D) Real-time qPCR analysis of STAT1 and p21 expression in T4121 and T387 GSC expressing vector or Flag-STAT1 (n = 3). (E) IB analysis of STAT1 and p21 expression in T4121 and T387 GSCs expressing Dox-inducible-Flag-STAT1. GSCs were treated with 100 ng/ml Dox for 0, 3, and 6 d. (F) The p21 promoter-reporter construct (WWP-Luc) is shown on top. Transcriptional activation of p21 was measured using a p21 promoter luciferase reporter assay (bottom). Luciferase activity was measured 60 h after transfection, and activity was normalized to the level of control vector expression (n = 3). (G) ChIP analyses on p21 (CDKN1A) promoter. Assays were performed with STAT1 antibody, and immunoprecipitates were subjected to qPCR analyses. Schematic showing the ChIP primer location with respect to the TSS of the p21 promoter (n = 3). (H) Relative cell viability of GSCs transduced with shCDKN1A in the setting of Flag-STAT1 overexpression. Cells were treated with indicated dose of IFN-α or IFN-β for 3 d. IB analyses of STAT1 and p21 expression in GSCs are shown (top). Data were normalized to untreated GSC group (n = 3). (I) IHC staining of p21 in GBM xenografts derived from T4121 GSCs expressing vector or Flag-STAT1 (top). The percentage of p21+ cells was quantified (bottom, n = 3). Data are represented as mean ± SD. *, P < 0.05; **, P < 0.01; ***, P < 0.001, as assayed by unpaired Student’s t test or Welch’s t test.

