Figure 5.
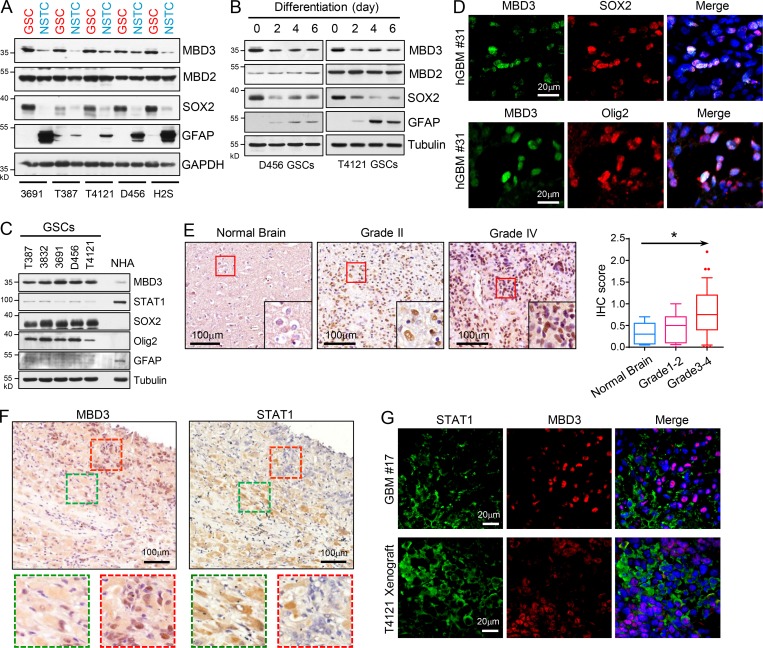
MBD3 is preferentially expressed in GSCs. (A) IB analysis of MBD3, MBD2, SOX2, and GFAP in GSCs and matched NSTCs derived from five human GBM tumors. (B) IB analysis of MBD3, MBD2, SOX2, and GFAP during GSC differentiation. (C) IB analysis of MBD3, STAT1, SOX2, and Olig2 in GSCs and NHAs. (D) Co-IF staining of MBD3 (green) and SOX2/Olig2 (red) in human GBM specimens. Nuclei were counterstained with Hoechst (blue). (E) IHC staining of MBD3 in brain tumor tissue microarray. Section was counterstained with hematoxylin (left). Box plot of histoscore of MBD3 (right). Normal brain tissue (n = 5), low-grade gliomas (I–II, n = 15), and high-grade gliomas (III–IV, n = 39). One-way ANOVA; *, P < 0.05. (F) IHC staining of MBD3 (left) and STAT1 (right) in serial sections of human GBM specimens. Sections were counterstained with hematoxylin. (G) Co-IF staining of STAT1 (green) and MBD3 (red) in human GBM specimen and mouse GBM orthotopic xenograft. Nuclei were counterstained with Hoechst (blue).

