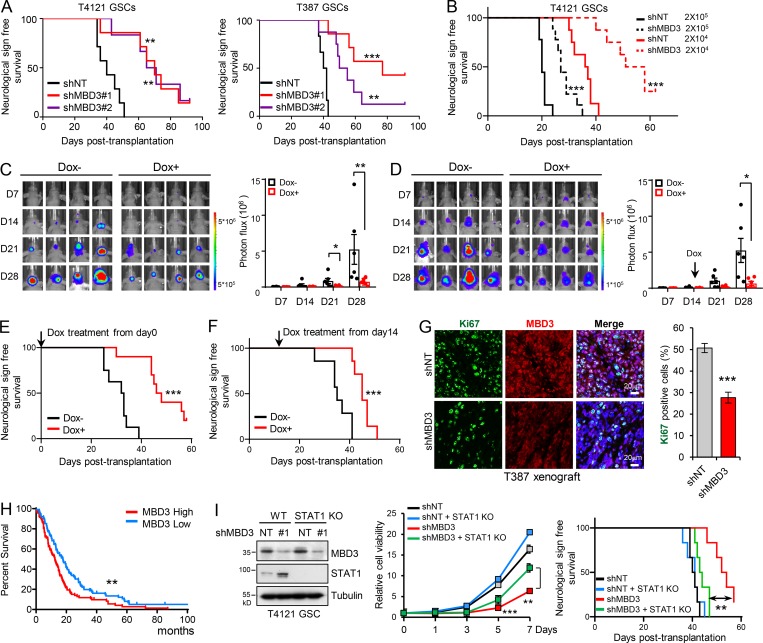
Figure 7.
Highly expressed MBD3 promotes GSC malignant progression. (A) GSCs expressing shNT or shMBD3s were transplanted into brains of nude mice (5 × 10⁴ cells/mouse). Kaplan–Meier survival curves of mice implanted with T4121 GSCs (shNT, n = 7; shMBD3#1, n = 6; shMBD3#2, n = 7) or T387 GSCs (shNT, n = 6; shMBD3#1, n = 8; shMBD3#2, n = 7) are shown. Log-rank test. (B) T4121 GSCs expressing shNT or shMBD3 were transplanted into brains of nude mice in a limiting dilution manner (2 × 10⁵ or 2 × 10⁴ cells/mouse, n = 9 or n = 8, respectively). Kaplan–Meier survival plots are shown. Log-rank test. (C–F) Luciferase-labeled T4121GSCs were transduced with the Tet-on-inducible shMBD3 and then transplanted into the brains of nude mice (2 × 10⁴ cells/mouse). Mice were treated with vehicle control or Dox (2 mg/ml in drinking water) to induce expression of shMBD3 from day 0 (C and E) or day 14 (D and F). GBM xenografts were tracked by bioluminescence, and the representative images from animals at the indicated time are shown (C and D, left). Bioluminescent quantification indicated that induced knockdown of MBD3 inhibited GSC tumor initiation and growth (C and D, right). Kaplan–Meier survival plots of mice are shown (E, shNT, n = 8; shMBD3, n = 10; F, n = 7 for each group). Unpaired Student’s t test for C and D. Log-rank test for E and F. (G) Co-IF staining of Ki67 and MBD3 in GBM xenografts derived from T387 GSCs expressing shNT or shMBD3 (left). The percentage of Ki67+ cells was quantified (right, n = 3). Data are represented as mean ± SD (unpaired Student’s t test). (H) Kaplan–Meier survival analysis of patients with high (n = 93) and low expression (n = 88) of MBD3 in REMBRANDT GBM dataset. Log-rank test. (I) Knockout of STAT1 rescued the inhibition of MBD3 depletion on GSC viability and tumor initiation. IB of WT and STAT1 KO GSCs transduced with shNT or shMBD3 (left). Cell viability was assessed with GSCs as indicated (middle, n = 3, unpaired Student’s t test). The indicated GSCs were transplanted into brains of nude mice (2 × 10⁴ cells/mouse). Kaplan–Meier survival curves of mice are shown (n = 6 for each group). Log-rank test. Data are represented as mean ± SD (G and I) or mean ± SEM (C and D). *, P < 0.05; **, P < 0.01; ***, P < 0.001. nu/nu nude mice were used in the animal experiments.

