Figure S1.
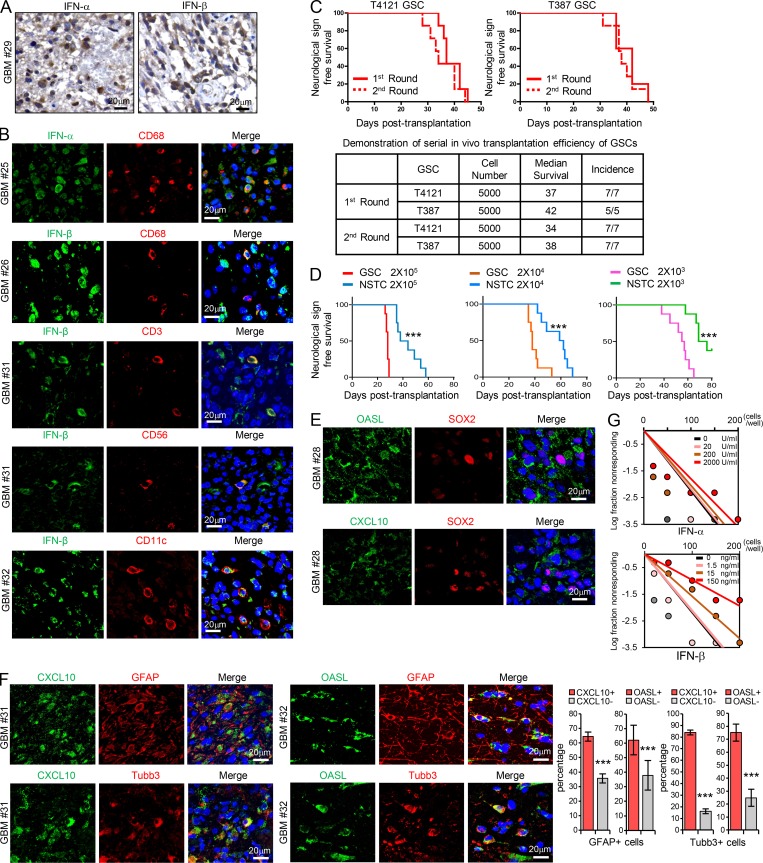
GSCs display less sensitivity to type I IFNs suppression. (A) IHC staining of IFN-α and IFN-β in human GBM specimens. Section was counterstained with hematoxylin. (B) Co-IF staining of IFN-α or IFN-β (green) with macrophage marker CD68, T cell marker CD3, natural killer cell marker CD56, and dendritic cell marker CD11c (red) in human GBM specimens. Nuclei were counterstained with Hoechst (blue). (C) GSCs tumor initiation in the in vivo serial transplantation. 5 × 10³ GSCs (T4121 or T387) were intracranially injected into the brains of nude mice (nu/nu) for the primary xenograft. All recipients developed tumor and died within 50 d, and these tumor cells (5 × 10³) could be serially transplanted at the second round, suggesting the long-term self-renewal and tumorigenicity of GSCs. Kaplan–Meier survival curves of mice implanted with GSCs are shown (top). Summary of the serial transplantation experiment is shown (bottom). (D) In vivo limiting dilution assays were performed with T387 GSCs and matched NSTCs. Kaplan–Meier survival plots are shown. n = 8 for each group, log-rank test. (E and F) Co-IF staining of OASL or CXCL10 (green) with SOX2 (red; E) or with GFAP or b3-tubulin (red; F) in human GBM specimens. Nuclei were counterstained with Hoechst (blue). Quantification are shown (percentage of CXCL10+/− or OASL+/− cells in GFAP+ cells, n = 10; percentage of CXCL10+/− cells in Tubb3+ cells, n = 10; percentage of OASL+/− cells in Tubb3+ cells, n = 15; unpaired Student’s t test). Data are represented as mean ± SD. (G) Limiting dilution analysis of the effect of IFN-α or IFN-β on T387 GSCs. Cells were plated in a limiting dilution manner (1–200 cells per well, 10 wells per condition). 10 d later, each well was evaluated for the presence or absence of tumorsphere. ***, P < 0.001.

