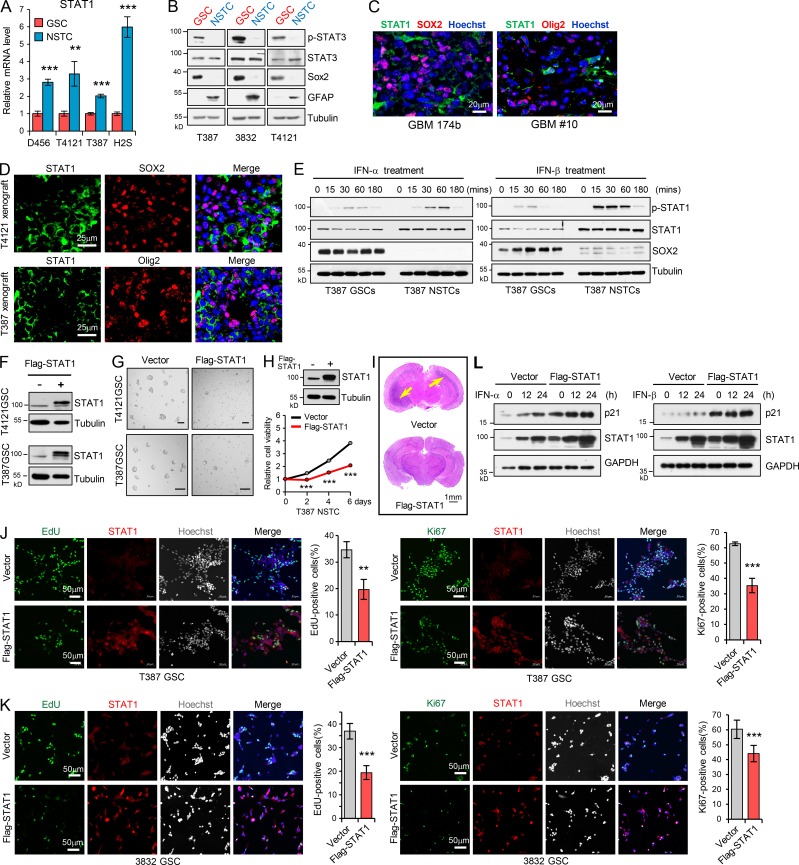
Figure S2.
Low STAT1 expression is associated with GSC proliferation and tumorigenicity. (A) mRNA levels of STAT1 in 4 GSCs and matched NSTCs were analyzed by real-time qPCR (n = 3). (B) IB analysis of p-STAT3 (Tyr705), STAT3, SOX2, Olig2, and GFAP in GSCs and matched NSTCs. (C and D) Co-IF staining of STAT1 (green) and SOX2 or Olig2 (red) in human GBM specimens (C) and mouse xenografts (D). Nuclei were counterstained with Hoechst (blue). (E) GSCs and matched NSTCs (T387) were treated with IFN-α (200 U/ml) or IFN-β (15 ng/ml) for indicated times. Phosphorylated-STAT1, STAT1, SOX2, and tubulin were examined by IB analysis. (F) IB analysis of Flag-STAT1 overexpression in GSCs. (G) Tumorsphere formation assay of GSCs expressing vector or Flag-STAT1. Tumorsphere images were assessed by bright-field microscopy. Scale bar represents 100 μm. (H) Cell viability of NSTCs (T387) expressing vector or Flag-STAT1 (n = 3). (I) Representative images of cross sections (H&E stain) of mouse brains (nu/nu) 31 d after transplantation with T4121 GSC expressing vector or Flag-STAT1. (J and K) Overexpression of Flag-STAT1 inhibited GSC proliferation. EdU incorporation assay (J and K, left) and Ki67 staining (J and K, right) in T387 GSCs (J, n = 3) and 3832 GSCs (K, n = 6) expressing vector or Flag-STAT1. Representative images are shown. The percentage of EdU+ or Ki67+ cells was quantified. (L) Flag-vector- or Flag-STAT1–overexpressing GSCs (T4121) were treated with IFN-α (200 U/ml) or IFN-β (15 ng/ml) for the indicated times. The indicated protein levels were analyzed by IB. Data are represented as mean ± SD. **, P < 0.01; ***, P < 0.001, as assayed by unpaired Student’s t test.

