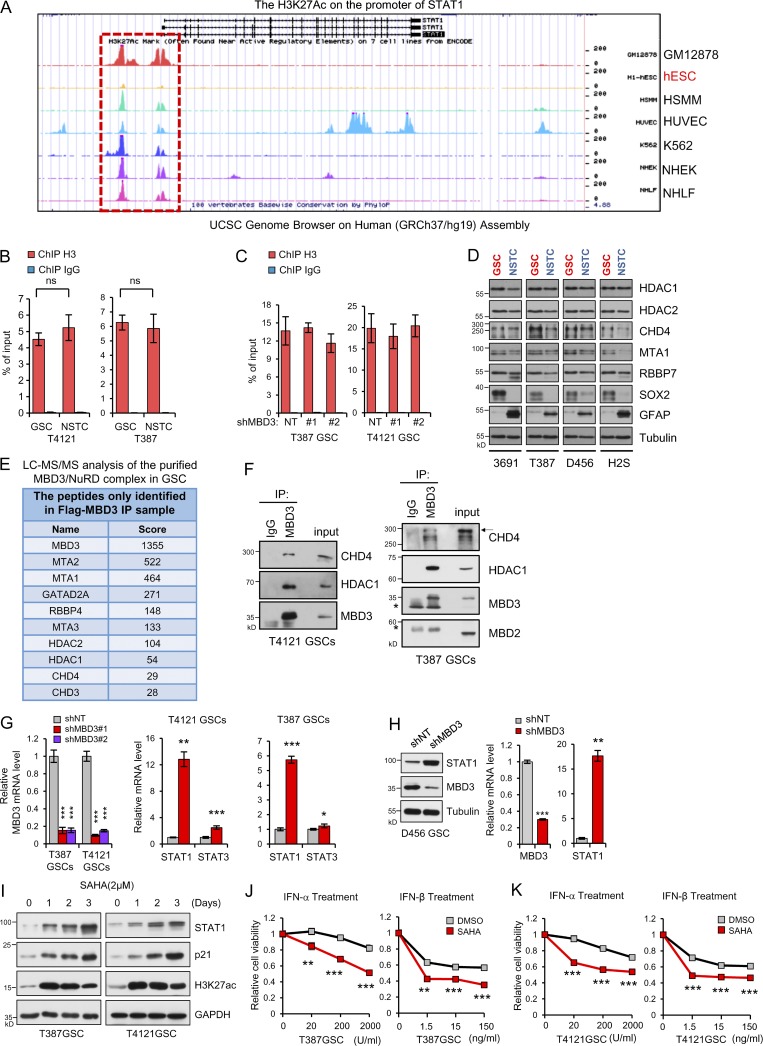
Figure S3.
The MBD3/NuRD complex promotes H3K27 deacetylation on STAT1 promoter to inhibit STAT1 expression in GSCs. (A) The UCSC Genome Browser shows the acetylation of H3K27 on the promoter of STAT1 in GM12878 (B-lymphocyte), hESC (human embryonic stem cells), HSMM (skeletal muscle myoblasts), HUVEC (human umbilical vein endothelial cell), K562 (leukemia), NHEK (epidermal keratinocytes), and NHLF (lung fibroblasts) cells. (B and C) ChIP analyses on STAT1 promoter in GSCs/NSTCs or GSCs expressing shNT/shMBD3s. Assays were performed with the H3 antibody, and immunoprecipitates were subjected to qPCR analyses (n = 3). (D) IB analysis of the indicated genes in 4 GSCs and matched NSTCs derived from 4 human GBM tumors. (E) Liquid chromatography-tandem MS (LC MS/MS) analysis of the purified MBD3/NuRD complex in GSC. Flag IP was performed in T387 GSC expressing Flag-MBD3. The components of NuRD complex were identified with MS. (F) IP of MBD3 was performed in T4121GSCs (left) and T387GSCs (right). The IB for CDH4, HDAC1, MBD3, and MBD2 are shown. IgG was used as an antibody control for IPs. Asterisks indicate nonspecific bands. (G) Real-time qPCR analysis of mRNA levels of MBD3, STAT1, and STAT3 in T4121GSCs or T387GSCs expressing shNT or shMBD3s (n = 3). (H) Knockdown of MBD3 increased the expression of STAT1 in both mRNA and protein in D456 GSCs (n = 3). (I) IB analysis of STAT1, p21, and H3K27ac in GSCs treated with SAHA for the indicated times. (J and K) T387 GSCs (J, n = 3) and T4121 GSCs (K, n = 3) were treated with the indicated dose of IFN-α/IFN-β in the absence or presence of SAHA (2 mM) for 3 d. Cell viability was assessed and normalized to the untreated control. Data are represented as mean ± SD. *, P < 0.05; **, P < 0.01; ***, P < 0.001, as assayed by unpaired Student’s t test or Welch’s t test. ns, not significant.

