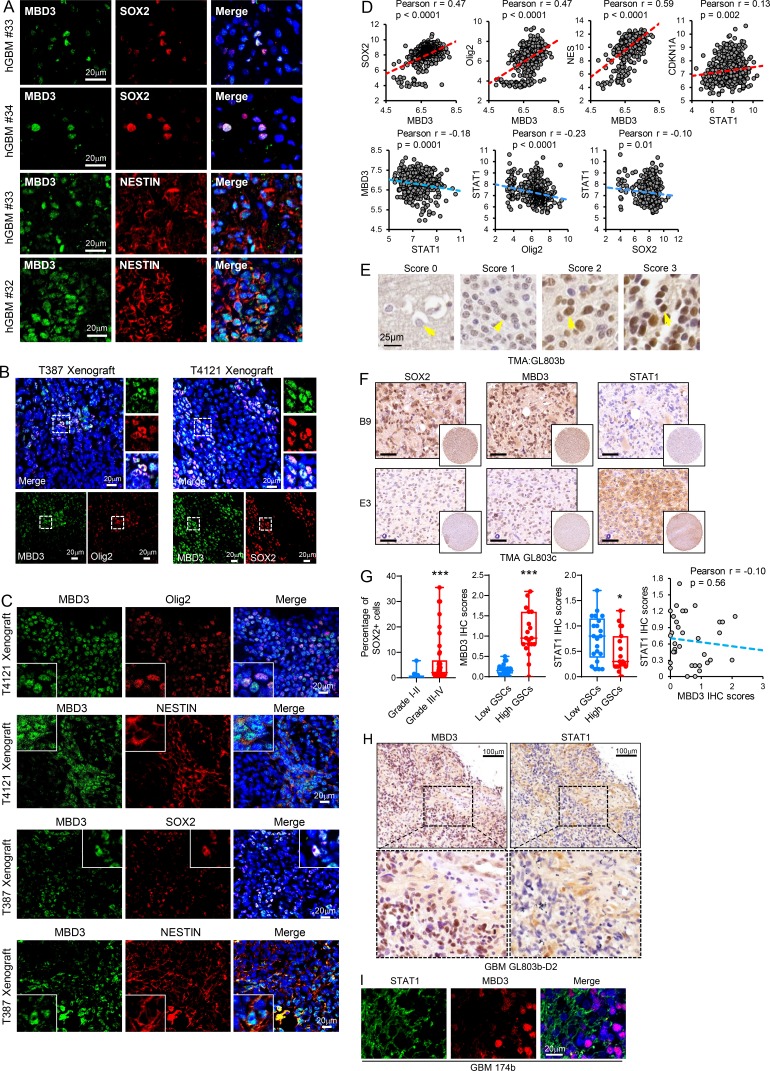
Figure S4.
MBD3 is preferentially expressed in GSCs. (A) Co-IF staining of MBD3 (green) and SOX2, NESTIN (red) in human GBM specimens. Nuclei were counterstained with Hoechst (blue). (B and C) Co-IF staining of MBD3 (green) and SOX2, Olig2, NESTIN (red) in mouse GBM xenografts. Nuclei were counterstained with Hoechst (blue). (D) Pairwise correlation analysis of the indicated genes in TCGA GBM database. Pearson correlation coefficient (r) value and P value are shown (n = 538). (E–H) IHC staining of SOX2, MBD3, and STAT1 in the serial sections of human glioma tissue microarrays. Sections were counterstained with hematoxylin (E, F, and H). IHC score of MBD3 in brain tumor tissue microarray (E). Boxplot (G, left) and correlation analysis (G, right; n = 35) of histoscores of the tissue microarray stained for indicated proteins are shown. Low-grade gliomas (I–II, n = 13) and high-grade gliomas (III–IV, n = 42). SOX2+ cells were quantified to imply the fraction of GSCs in tumor (G; low GSCs, n = 21; high GSCs, n = 19). The scale bar represents 50 μm (F). *, P < 0.05; ***, P < 0.001, as assayed by unpaired Student’s t test. (I) Co-IF staining of STAT1 (green) and MBD3 (red) in human GBM specimens. Nuclei were counterstained with Hoechst (blue).

