Figure 3.
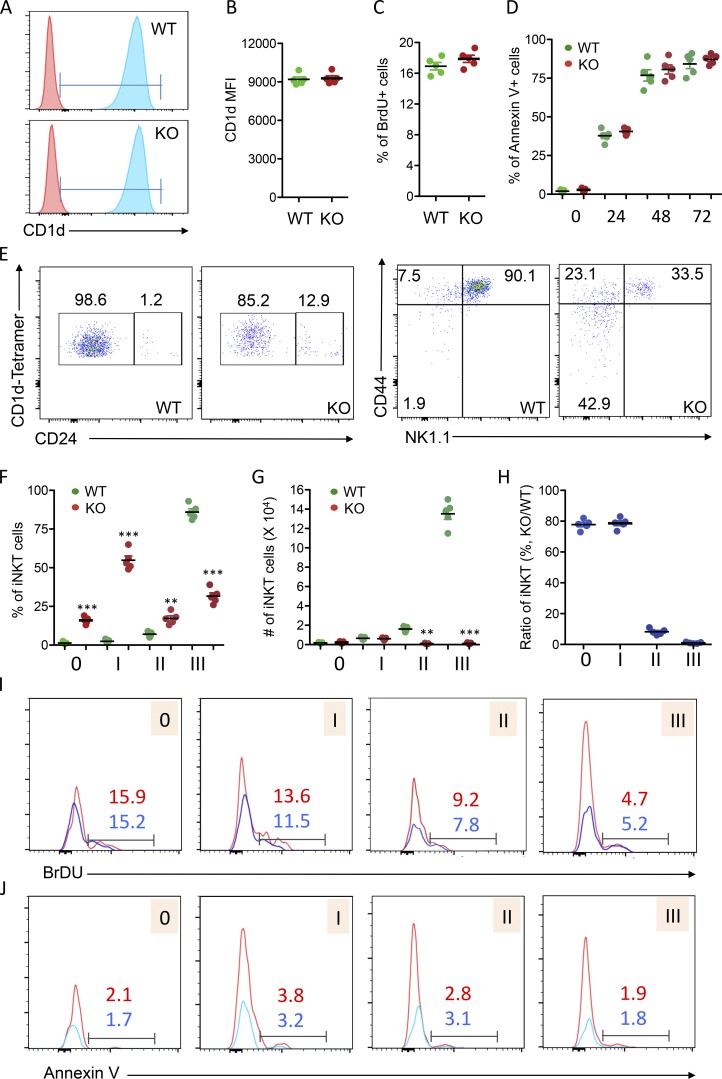
Analysis of iNKT cell development and maturation in WT and USP22 cKO mice. (A–D) Five pairs of WT and USP22 cKO mice were injected with BrdU. 24 h after treatment, mice were euthanized, and single-cell suspensions from their thymus were isolated, stained, and analyzed by flow. CD4+CD8+ cells in the thymus of WT and USP22 cKO mice were gated, and expression of CD1d was analyzed by flow cytometry. The representative images (A) and average mean fluorescence intensity (MFI; B) are shown. The BrdU+ proportions of CD4+CD8+ cells were analyzed (C). The annexin V+ cells in the gated CD4+CD8+ population were analyzed after in vitro culture for indicated hours. The average percentages of annexin V+ cells from five independent experiments are shown (D). (E–H) iNKT development in the thymus of WT and USP22 cKO mice was analyzed by their expression of CD24 (E, left panels). CD24−CD1d tetramer+ populations were further analyzed for their expression of NK1.1 and CD44 (E, right panels). Representative images from seven pairs of mice are shown, and the average percentages are indicated. The percentages (F) and absolute numbers (G) of each stage as indicated in E were calculated. The percentages in USP22 cKO iNKT relative to WT iNKT cells from seven pairs of mice are indicated (H). (I and J) The BrdU incorporation (I) and apoptotic cells (J) were analyzed in four pairs of mice and representative data are shown. Each symbol (B–D and F–H) represents an individual mouse. Error bars represent mean ± SD. Student’s t test was used for statistical analysis. **, P < 0.01; ***, P < 0.001. Data are from four experiments with samples pooled from multiple mice (A–H) or are representative of at least four experiments (I and J).

