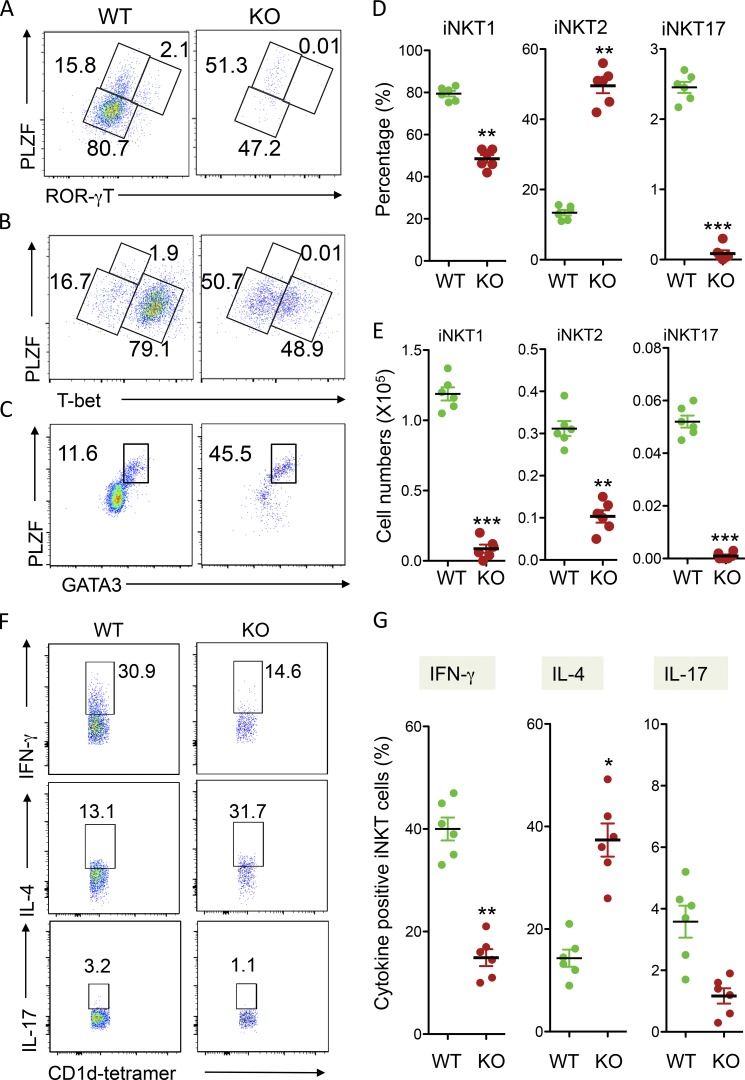
Figure 4.
Analysis of iNKT differentiation in USP22 cKO mice. (A–C) TCRβ and CD1d tetramer-positive iNKT cells in WT and USP22 cKO thymocytes were gated, and their expression of PLZF and ROR-γT (A), or T-bet (B), or GATA3 (C) was determined by intracellular staining and flow cytometry. (D and E) The average percentages (D) and absolute numbers (E) of iNKT1, iNKT2, and iNKT17 from six pairs of WT and USP22 cKO mice are shown. (F and G) The lineage-specific cytokine production in total splenic iNKT cells was determined by intracellular staining. Representative images (F) and data from six pairs of mice (G) are shown. Each symbol (D, E, and G) represents an individual mouse. Error bars represent mean ± SD. Student’s t test was used for statistical analysis. **, P < 0.01; ***, P < 0.001. In A–G, data are pooled from six independent experiments.

