Figure 6.
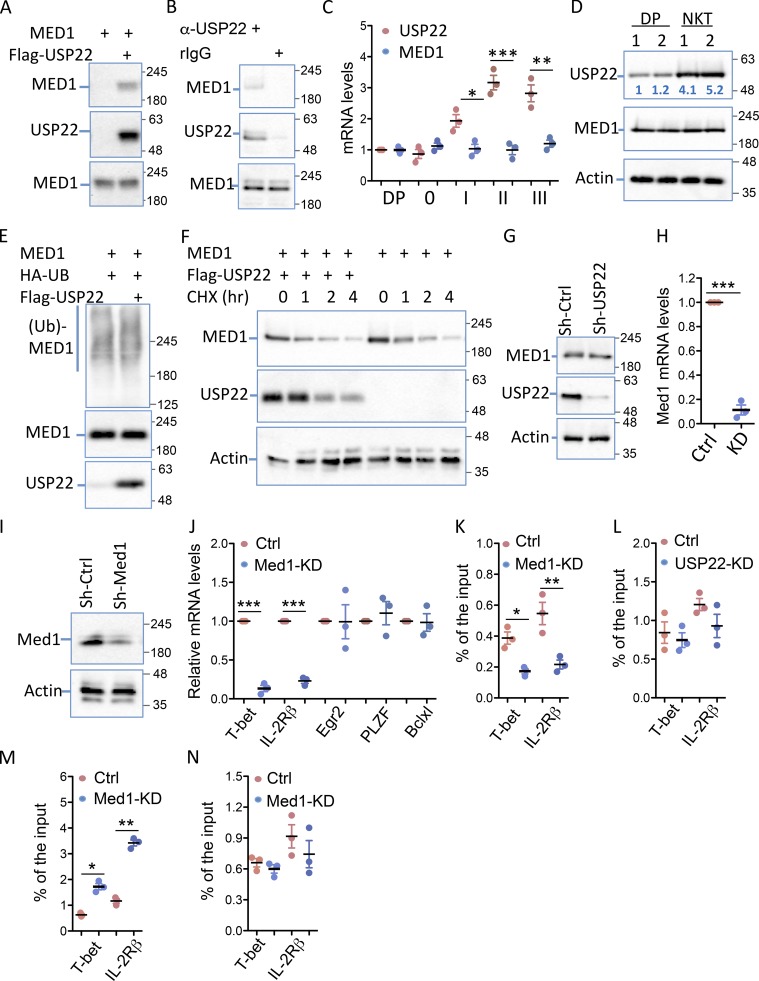
USP22 interacts with MED1 to regulate T-bet and IL-2Rβ transcription in iNKT cells. (A) MED1 interaction with USP22 in transiently transfected HEK293 cells was determined by coimmunoprecipitation with anti-Flag and Western blotting with anti-MED1 (top panel). The same membrane was reprobed with anti-USP22 (middle panels), and the expression of MED1 in the whole cell lysate was detected by Western blotting with anti-MED1 (bottom panel). (B) The interaction of endogenous USP22 with MED1 in DN32.D3 cells was determined using anti-USP22 and control rabbit IgG as described in A. (C and D) The expression levels of USP22 and MED1 in sorted CD4+CD8+ DP cells and iNKT cells at each stage were determined by real-time RT-PCR (C). The protein expression levels of USP22 and MED1 in sorted CD4+CD8+ cells and iNKT cells were determined by Western blotting, and the numbers indicate the relative levels of USP22 protein expression (D). (E) MED1 and HA-ubiquitin (Ub) expression plasmids were cotransfected with or without USP22, and the ubiquitin conjugation on MED1 was determined by coimmunoprecipitation with anti-MED1 and Western blotting with anti-HA (top panel). The same membrane was reblotted with anti-MED1 (middle panel), and the levels of USP22 protein in the whole cell lysates were determined (bottom panel). (F) The effect of USP22 expression on MED1 protein stability was determined in HEK293 cells treated with cychloheximide (CHX) for different times. (G) The expression levels of MED1 in USP22 KD cells were determined with β-actin as a loading control. (H and I) MED1-specific knockdown DN32.D3 cells were generated and validated by real-time RT-PCR (H) and Western blotting (I). (J) The expression levels of each indicated genes in the MED1 knockdown (KD) and WT control (Ctrl) cells were determined by real-time RT-PCR. (K and L) The promoter-binding of USP22 in MED1 KD cells (K) and MED1 in USP22 KD (L) cells were determined by ChIP. (M and N) The levels of H2A (M) and H2B (N) monoubiquitination at the promoters of T-bet and IL-2Rβ were analyzed by ChIP. Error bars represent mean ± SD from three experiments (A–N). Student’s t test was used for statistical analysis. *, P < 0.05; **, P < 0.01; ***, P < 0.001.

