Figure 3.
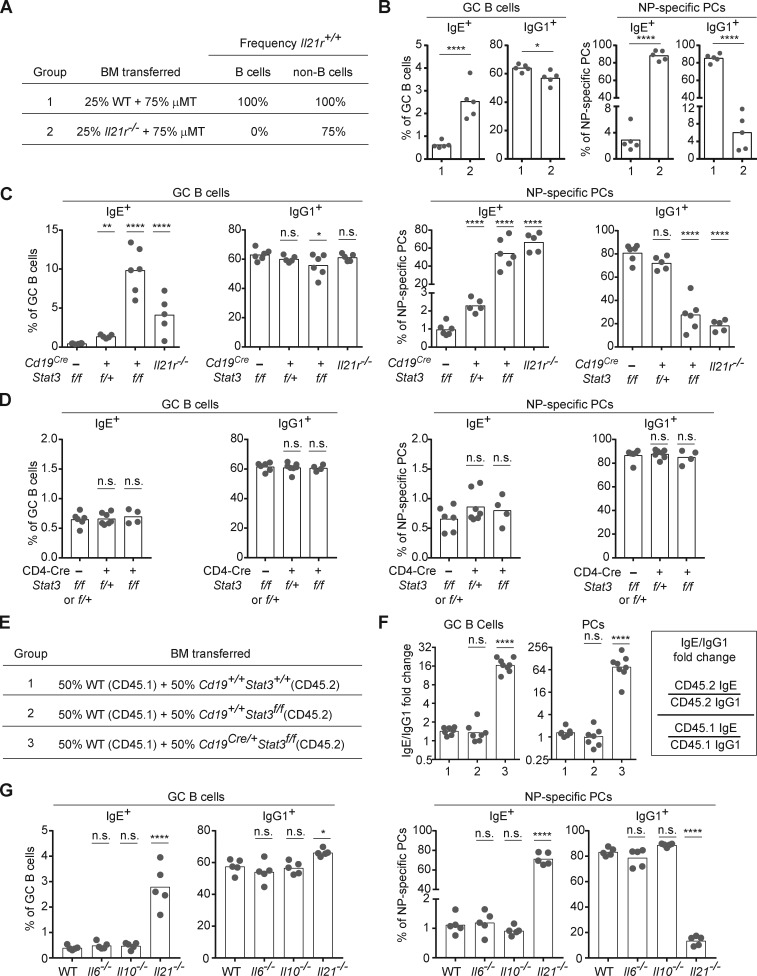
IL-21 suppresses IgE responses through the IL-21R–STAT3 signaling axis in B cells. Draining LNs were collected 7 d after subcutaneous immunization with NP-CGG in alum adjuvant, and then cells were analyzed by flow cytometry to enumerate isotype-specific GC B cells and NP-specific PCs as in Fig. 1. (A) Groups of BM chimeras generated to test the impact of selective deficiency of the IL-21R in B cells. The indicated combinations of BM cells were transplanted into lethally irradiated μMT recipient mice. WT BM was obtained from a B6/J mouse bred in our colony. The expected frequencies of cells capable of IL-21R expression (frequency Il21r+/+) are indicated. (B) Frequency of IgE+ and IgG1+ cells in the GC B cell and NP-specific PC compartments in BM chimeras generated as in A. (C and D) Frequency of IgE+ and IgG1+ cells in the GC B cell and NP-specific PC compartments in mice with conditional Stat3 deletion in B cells (C) or T cells (D). Control mice were littermates. Il21r−/− mice were included for comparison in C. (E) Groups of BM chimeras generated to test the cell intrinsic role of STAT3 in B cells. The WT CD45.1 BM donor was a purchased NCI B6 CD45.1 mouse. The Cd19+/+ Stat3+/+ BM was from a B6 mouse bred in our colony. The Cd19+/+ Stat3f/f BM and Cd19Cre/+ Stat3f/f BM were from littermates. The indicated mixtures of BM cells were transferred into lethally irradiated CD45.1 WT recipients (NCI B6 CD45.1). (F) Fold change in the ratio of IgE+ cells to IgG+ cells (IgE/IgG1) among CD45.2 cells compared with CD45.1 cells in the GC B cell and PC compartments in the mixed BM chimeras generated as in E. The calculation of the ratio is indicated in the box on the right. Note that total PCs (rather than NP-specific PCs) were enumerated to allow for quantification of CD45.1+ vs. CD45.2+ cells. (G) Frequency of IgE+ and IgG1+ cells in GC B cell and NP-specific PC compartments in WT, Il6−/−, Il10−/−, and Il21−/− mice. WT mice were B6/J bred in our colony. Dots represent individual mice. Bars represent the mean (frequency plots) or geometric mean (relative IgE/IgG1 plots). n.s., not significant; *, P < 0.05; **, P < 0.01; ****, P < 0.0001 (t tests with the Holm-Sidak correction for multiple comparisons [B] or one-way ANOVA with Dunnett’s post-test comparing each group to the leftmost control group [C, D, F, and G]). The B cell–intrinsic role shown in A, B, E, and F was confirmed in a separate set of chimeras with a mixture of Il21r+/+ and Il21r−/− B cells (data not shown). Data in C and D are representative of three experiments. The comparison of WT, Il10−/−, and Il21−/− mice in G was confirmed in a separate experiment.

