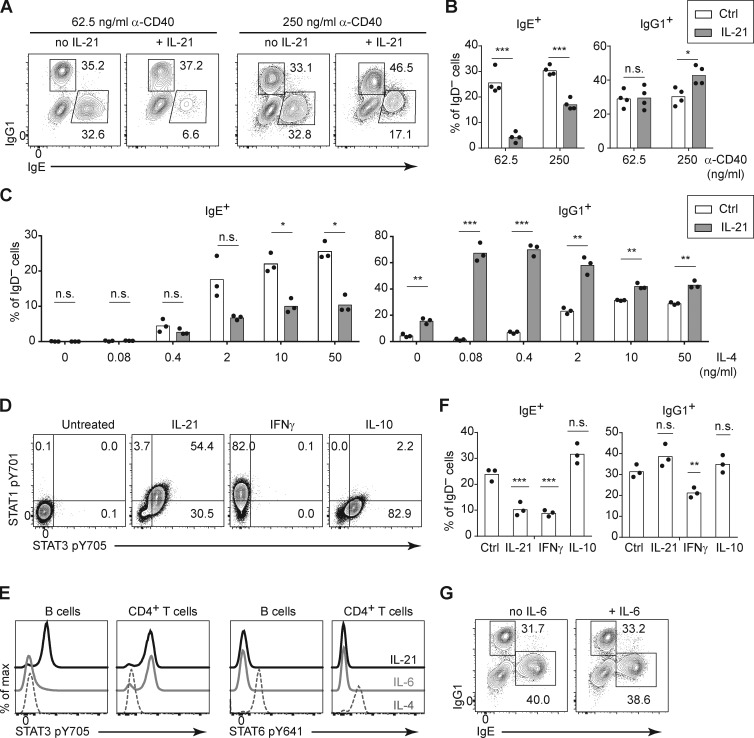
Figure 5.
IL-21 inhibits IgE and promotes IgG1 responses of cultured mouse B cells depending on the strength of CD40 and IL-4 signals. (A and B) Representative flow cytometry of IgD− activated B cells (A) and quantification of the frequency of IgE+ and IgG1+ cells (B). Purified B cells were cultured for 4 d with a fixed concentration of IL-4 (12.5 ng/ml) and the indicated concentrations of anti-CD40 (α-CD40) in the presence or absence of IL-21 (50 ng/ml). (C) Quantification of the frequency of IgE+ and IgG1+ cells among IgD– activated B cells. Splenocytes were cultured for 4 d with a fixed concentration of anti-CD40 (125 ng/ml) and the indicated concentrations of IL-4 in the presence or absence of IL-21 (25 ng/ml). (D) Representative flow cytometry of B cells (gated as B220+) after splenocytes were incubated with the indicated cytokines (IL-21, IFN-γ, or IL-10; 100 ng/ml each) for 20 min at 37°C. (E) Representative flow cytometry of B cells (gated as B220+) and CD4+ T cells (gated as CD4+) after splenocytes were incubated with the indicated cytokines (IL-21, IL-6, or IL-4; 50 ng/ml each) for 15 min at 37°C. (F) Quantification of the frequency of IgE+ and IgG1+ cells among IgD− activated B cells. Purified B cells were cultured for 4 d with anti-CD40 (125 ng/ml) and IL-4 (12.5 ng/ml) alone (Ctrl) or with the addition of the indicated cytokines (IL-21 50 ng/ml, IFN-γ 25 ng/ml, or IL-10 25 ng/ml). (G) Representative flow cytometry of IgE+ and IgG1+ B cells within the population of class-switched B cells (B220+ IgD− IgM−) after splenocytes were cultured for 4 d with anti-CD40 (62.5 ng/ml) and IL-4 (25 ng/ml) in the presence or absence of IL-6 (81 ng/ml). Cells were from WT mice on a B6 background or Boy/J CD45.1 congenic mice bred in our colony. Dots represent data points of cells from individual mice, and bars represent the mean (B, C, and F). n.s., not significant; *, P < 0.05; **, P < 0.01; ***, P < 0.001 (t tests with the Holm-Sidak correction for multiple comparisons [B and C] or one-way ANOVA followed by Dunnett’s post-test comparing each cytokine treatment to the control [F]). Data were pooled from four experiments (B) or three experiments (F) or are representative of two experiments (C–E) or three experiments (G).

