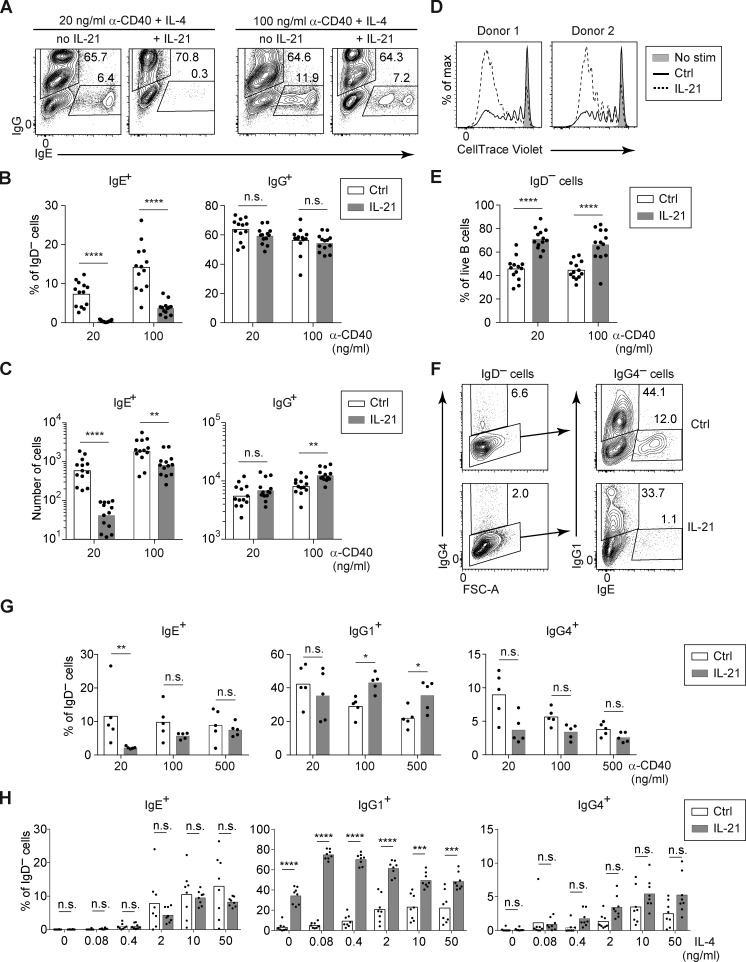
Figure 7.
IL-21 inhibits IgE and promotes IgG1 responses of cultured human B cells depending on the strength of CD40 and IL-4 signals. Total B cells (A–E) or naive B cells (F–H) were purified from human tonsils and cultured for 7 d with anti-CD40 (as indicated) and IL-4 (20 ng/ml, except in H), in the presence or absence of IL-21 (20 ng/ml). (A–C) Representative flow cytometry (A) and quantification of the frequency (B) and total number (C) of IgG+ and IgE+ cells among IgD− cells from cultures of total B cells with the indicated concentrations of anti-CD40 and a fixed concentration of IL-4 (20 ng/ml) in the presence or absence of IL-21. (D) Representative flow cytometry showing proliferation of total B cells cultured from human tonsils with anti-CD40 (100 ng/ml) and IL-4, in the presence or absence of IL-21, as measured by dilution of CellTrace Violet. (E) Frequency of activated (IgD−) cells among total tonsil B cells after culture with anti-CD40 (as indicated) and IL-4, in the presence or absence of IL-21, quantified as a percentage of live cells. (F–H) Representative flow cytometry (F) and quantification (G and H) of the frequency of IgG4+, IgG1+, and IgE+ B cells, quantified as a percentage of IgD− cells, after culturing naive B cells. (F) Naive B cells were cultured with anti-CD40 (20 ng/ml) and IL-4 in the presence or absence of IL-21. Cells were pregated as IgD– (left panels) to identify IgG4+ cells; gates for IgG1+ and IgE+ cells were then drawn within the IgG4− population (right panels). IgG1+ and IgG4+ populations were gated sequentially to account for cross-reactivity of the anti-IgG1 antibody with IgG4. (G) Naive B cells were cultured with a variable concentration of anti-CD40 as indicated with a fixed concentration of IL-4 (20 ng/ml), in the presence or absence of IL-21. (H) Naive B cells were cultured with a fixed concentration of anti-CD40 (100 ng/ml) and a variable concentration of IL-4, as indicated, in the presence or absence of IL-21. Dots represent data points from individual donors. Bars represent arithmetic (B, E, G, and H) or geometric (C) means. n.s., not significant; *, P < 0.05; **, P < 0.01; ***, P < 0.001; ****, P < 0.0001 (t tests with the Holm-Sidak correction for multiple comparisons). Data were pooled from 10 experiments (B, C, and E), five experiments (G), or two experiments (H). In D, each donor is from a different experiment, and the results for each donor were replicated in another experiment.

