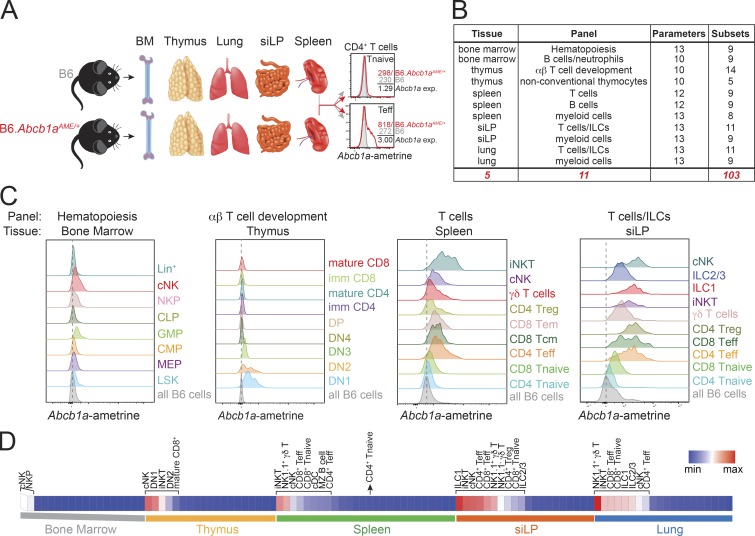
Figure 1.
Endogenous Abcb1a expression across the hematopoietic system. (A) Tissues (bone marrow [BM], thymus, spleen, lung, and small intestine lamina propria [siLP]) were harvested from three pairs of 6–8-wk-old female B6 wild-type or heterozygous Abcb1aAME/+ reporter mice to profile endogenous MDR1 (Abcb1a) gene expression (exp) across the mouse hematopoietic compartment. Identically gated control and reporter cell subsets were gated, and normalized Abcb1a expression for each cell type was calculated by dividing ametrine MFI in Abcb1aAME/+ reporter cells by the background MFI in wild-type B6 cells; two examples of this analysis are shown for cells in spleen (top: CD4+ naive [Tnaive]; bottom: CD4+ effector/memory [Teff]). (B) Names and descriptions of the FACS antibody panels used to discriminate hematopoietic cell types in the tissues indicated in A. See also Table S1 for a full list of the cell types and developmental stages analyzed and the gating hierarchies. ILCs, innate lymphoid cells. (C) Representative Abcb1aAME reporter expression, determined by flow cytometry as in A, in cells from (left to right) bone marrow, thymus, spleen, and siLP. CLP, common lymphoid progenitor; CMP, common myeloid progenitor; cNK, conventional NK cells (mix of immature and mature); DN, double negative; GMP, granulocyte/macrophage progenitor; ILC1, group 1 innate lymphoid cells; ILC2/3, group 2/3 innate lymphoid cells; iNKT, invariant NK T cells; LSK, Lin−Sca-1+c-Kit−; MEP, megakaryocyte/erythrocyte progenitor; NKP, NK progenitor; Tcm, central memory T cells; Tem, effector memory T cells; Treg, regulatory T cells. Abcb1aAME expression in each gated population is shown; due to space constraints, gray/shaded peaks show background ametrine expression in all live B6 wild-type cells, gated only on forward/side scatter and viability, from the same tissue. Vertical dotted lines indicate background ametrine MFIs in all B6 wild-type cells. Representative of three pairs of B6 wild-type and Abcb1aAME/+ reporter mice analyzed over two independent experiments. (D) Normalized mean Abcb1aAME reporter expression (n = 3) in all 103 hematopoietic cell types and developmental stages analyzed as in C (see also Fig. S1). Each tissue is presented in rank order from high to low Abcb1aAME/+ reporter expression. Cell types displaying Abcb1aAME expression above background in each tissue are annotated. Spleen CD4+ Tnaive cells are annotated as a negative reference point (i.e., cells that lack biologically significant MDR1 expression; Cao et al., 2017). max, maximum; min, minimum.

