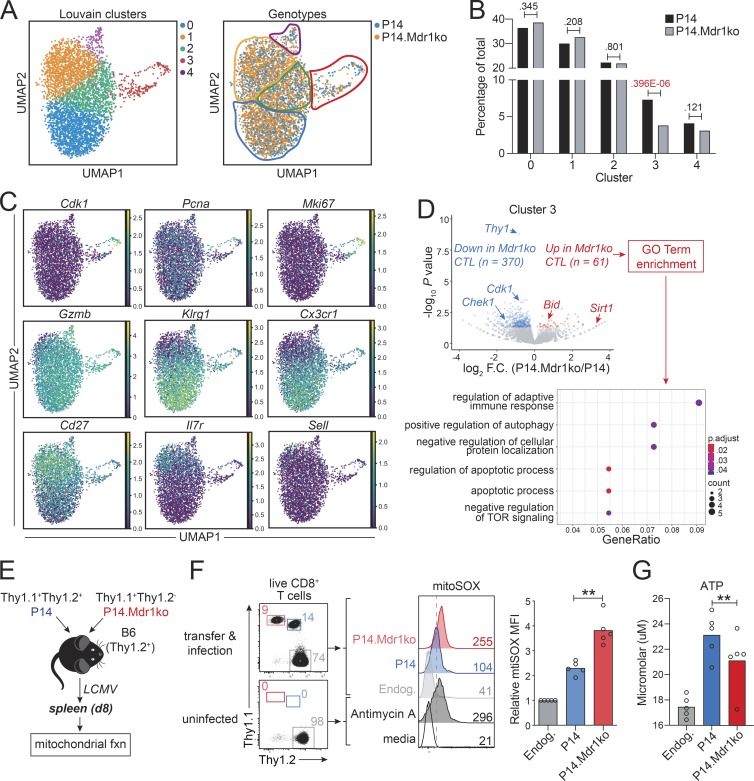
Figure 4.
MDR1 enforces survival and mitochondrial fitness in early mitotic CTLs. (A) scRNA-seq analysis of congenically transferred wild-type and MDR1-deficient (Abcb1a/1b−/−; Mdr1ko) P14 CTLs from LCMV-infected mice at day 8 after infection (as in Fig. 3 A). UMAP was used to visualize dimensionally reduced transcriptomics data. Left: Louvain clustering identified five cell clusters (color-coded); Right: CTL distribution by genotype (P14; blue, P14.Mdr1ko; orange) is shown. (B) Distribution of control (P14; black) or MDR1-deficient (P14.Mdr1ko; gray) CTLs across the five clusters identified in A. Percentages of total cells (per genotype) is shown; exact chi-square P values are indicated. (C) Normalized expression (TPM) of cluster-defining genes as in A. (D) Top: Volcano plot showing differential gene expression between cluster 3 (mitotic) control (P14) and MDR1-deficient (P14.Mdr1ko) CTLs (cluster 3 identified as in A and C). Gene expression is based on the mean expression among all cells (per genotype) within the cluster; genes significantly increased or decreased (P < 0.05, DESeq2) in MDR1-deficient vs. control CTLs are highlighted red or blue, respectively. Bottom: GO terms significantly enriched (P < 0.05, ClusterProfiler) among genes identified above that are increased in MDR1-deficient vs. control P14 cells. All scRNA-seq data are from P14 cells sorted from five pooled spleens of LCMV-infected mice; data shown are analyzed from one independent experiment and representative of two independent experiments. TOR, target of rapamycin. (E) Mitochondrial function (fxn) was assessed in congenically transferred MDR1-sufficient (P14; blue) and MDR1-deficient (P14.Mdr1ko; red) P14 CTLs 8 d after LCMV infection. (F) Left: Ex vivo analysis of control (Thy1.1+Thy1.2+; blue) or MDR1-deficient (Thy1.1+Thy1.2−; red) P14 CTLs or endogenous (Endog.; gray) CD8+ T cells from spleens of LCMV-infected or uninfected B6 mice. Middle: Mitochondrial superoxide production, determined by mitoSOX staining and flow cytometry, in MDR1-sufficient (P14; blue) or MDR1-deficient (P14.Mdr1ko; red) P14 CTLs or in endogenous (Endog.; gray) CD8+ T cells from congenically transferred and LCMV-infected wild-type B6 mice (Top; as in E). Parallel mitoSOX staining was performed on endogenous CD8+ T cells from spleens of uninfected wild-type B6 mice; CD8+ T cells from uninfected animals were treated ex vivo with or without the mitochondrial complex III inhibitor, Antimycin A, to validate staining (Bottom). Color-matched text indicates mitoSOX MFIs; representative of five mice analyzed over two independent experiments. Right: Mean relative mitoSOX MFIs (n = 5) in MDR1-sufficient (P14; blue) or MDR1-deficient (P14.Mdr1ko; red) P14 CTLs or in endogenous (Endog.; gray) CD8+ T cells, determined by flow cytometry as above. Individual data points for each animal are shown. **P < 0.01, paired two-tailed Student’s t test. (G) Mean ATP concentration (n = 5), determined by ex vivo CellTiter-Glo Luminescent Viability Assay at day 8, in MDR1-sufficient (P14; blue) or MDR1-deficient (P14.Mdr1ko; red) P14 CTLs or in endogenous (Endog.; gray) CD8+ T cells, from congenically transferred and LCMV-infected mice as in E and F. Individual data points for each animal are shown analyzed over three independent experiments. **P < 0.01, paired two-tailed Student’s t test.

