Figure S1.
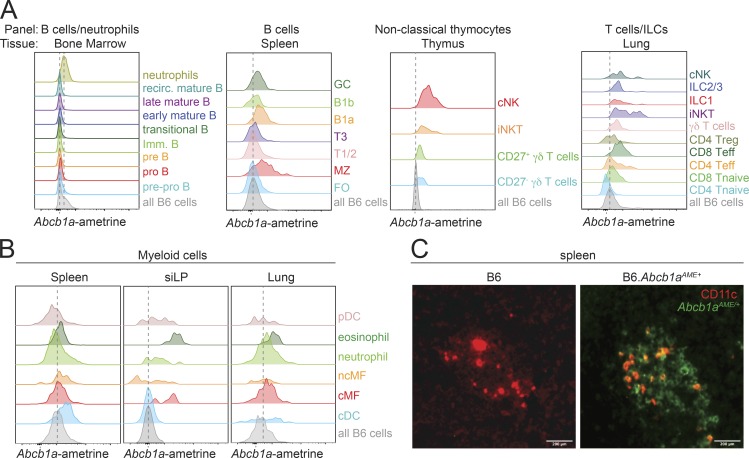
Endogenous Abcb1a expression across the hematopoietic system. (A) Representative Abcb1aAME reporter expression in select cell types from (left to right) bone marrow, spleen, thymus, and lung. cNK, conventional NK cells; FO, follicular B cells; GC, germinal center B cells; imm. B, immature B cells; iNKT, invariant NK T cells; MZ, marginal zone B cells; recirc. mature B, recirculating mature B cells; T1/2 T1 and T2 transitional B cells, T3, transitional T3 B cells; Treg, regulatory T cells; Tnaive, naive T cells. As in Fig. 1, normalized Abcb1aAME expression across subsets was quantified by comparing ametrine MFIs in identically gated Abcb1aAME/+ reporter or wild-type B6 cells but is presented in all Abcb1aAME/+ reporter subsets and all tissues with only a single gray/shaded peak reflecting the distribution of background ametrine expression in all live wild-type B6 cells, gated only on forward/side scatter and viability, from the same tissue. Vertical dotted lines indicate background ametrine MFIs in all wild-type B6 cells. (B) Representative Abcb1aAME reporter expression, determined by ex vivo flow cytometry and presented as in A, in select myeloid cells from (left to right) spleen, siLP, and lung. cDC, conventional dendritic cells; cMF, classical macrophages; ncMF, nonclassical macrophage; pDC, plasmacytoid dendritic cell. Data are representative of three pairs of B6 wild-type and Abcb1aAME/+ reporter mice analyzed over two independent experiments in A and B. (C) Fluorescence microscopy of frozen spleen sections from wild-type (B6; left) or MDR1-reporter (B6.Abcb1aAME/+; right) mice. Native Abcb1aAME/+ reporter fluorescence (green) and anti-CD11c staining (red) is shown; colocalization of ametrine and CD11c fluorescence is indicated by orange coloring. Magnification ×10; scale bar = 200 µm; representative of five mice per genotype analyzed over two independent experiments.

