Figure S4.
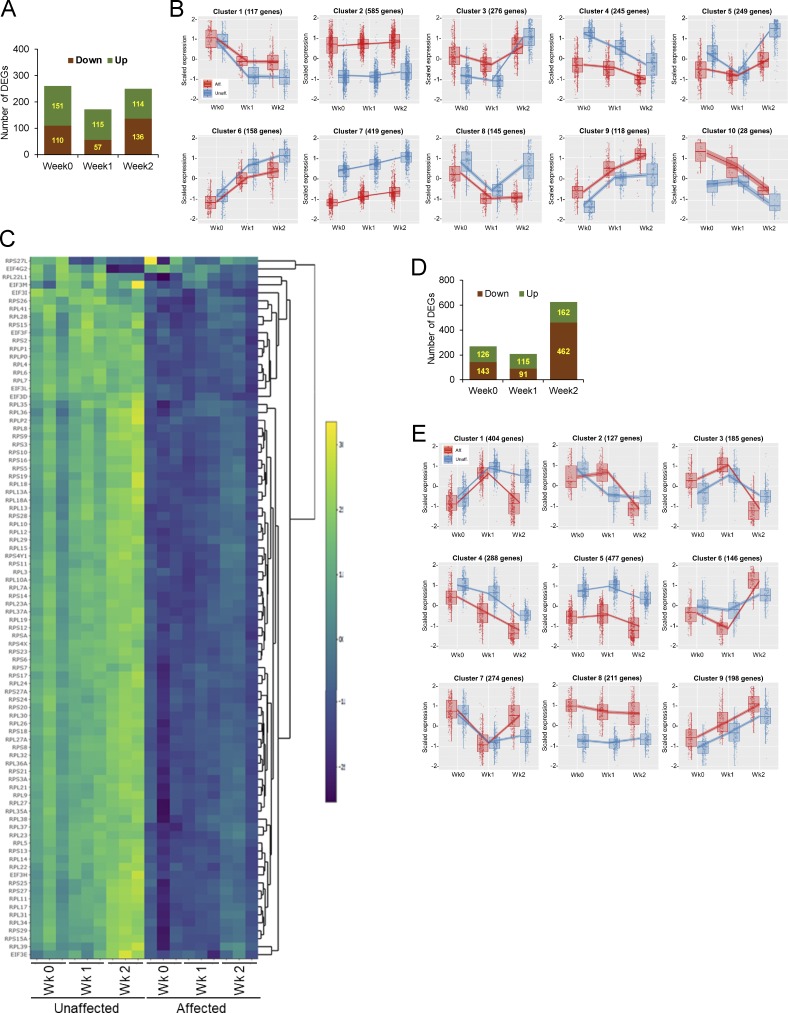
Transcriptome profiling by RNA-Seq. (A–C) BMP2(−) condition. (A) A bar graph shows total number of DEGs with more than twofold changes (FDR < 1e-20) at 0-, 1-, and 2-wk time points in conventional osteogenic media without recombinant BMP2. (B) Clusters from degPatterns analysis of RNA-Seq data. The number of member genes in each cluster is also shown. (C) Cell growth inhibition by SMAD3 gain-of-function mutation. Heatmap of gene sets in eIF2 pathway displays significant down-regulation of ribosomal protein components (RPS [ribosomal protein S] and RPL (ribosomal protein L]) in affected cells. (D and E) BMP2(+) condition. (D) A bar graph shows total number of DEGs with more than twofold changes (FDR < 1e-20) at 0-, 1-, and 2-wk time points in conventional osteogenic media supplemented with recombinant BMP2. (E) 9 clusters from degPatterns analysis of RNA-Seq data. The number of member genes in each cluster is also shown. Aff, affected; Unaff, unaffected.

