Fig. 1.
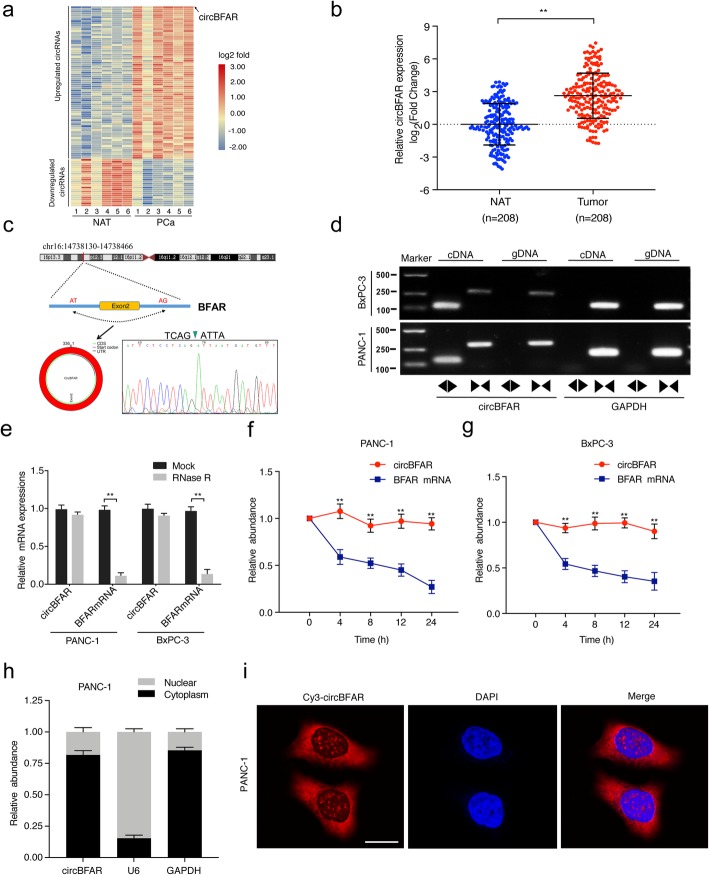
Identification and characterization of circBFAR in PDAC cells. a A heatmap showing the differentially expressed circRNAs in six pancreatic cancer tissues and corresponding NATs. The red and blue scales represent higher or lower expression levels, respectively. b qRT-PCR analysis of circBFAR in 208 paired PDAC and adjacent noncancerous tissues. The nonparametric Mann-Whitney U-test was used. c Schematic illustration showing the genomic loci of the BFAR gene and the circBFAR derived from exon 2 of BFAR. A green arrow indicates the “head-to-tail” splicing sites of circBFAR, which were validated by Sanger sequencing. d Combining PCR with an electrophoresis assay indicated the presence of circBFAR using divergent and convergent primers from cDNA or genomic DNA (gDNA) in PANC-1 and BxPC-3 cells. e qRT-PCR analysis for the resistance of circBFAR and linear BFAR to RNase R in PANC-1 and BxPC-3 cells. The mock treatment is the negative control. Two-tailed t-tests was used. f, g Actinomycin D assay to evaluate the stability of circBFAR and BFAR mRNA in PANC-1 and BxPC-3 cells. Two-tailed t-tests was used. h The location of circBFAR was confirmed using a subcellular fractionation assay and qRT-PCR data indicate that circBFAR is mainly located in the cytoplasm. i Representative FISH images showing the cellular localization of circBFAR. The circBFAR probe was labeled with Cy3 (red), nuclei were stained with DAPI (blue). The images were photographed at 1000X magnification. Scale bar = 10 μm. The error bars represent the standard deviations of three independent experiments. *P < 0.05, **P < 0.01

