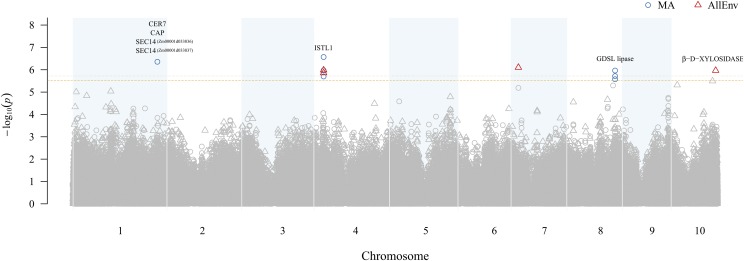
Figure 1.
Manhattan plot of results from a genome-wide association study (GWAS) of adult maize leaf cuticular conductance (gc) conducted in Maricopa (MA) and across all four environments (AllEnv). The -log10 P-value of each SNP tested in a mixed linear model analysis of gc is plotted as a point against its physical position (B73 RefGen_v4) for the 10 chromosomes of maize. The least significant single-nucleotide polymorphism (SNP) at a genome-wide false discovery rate of 10% in MA and AllEnv is indicated by a dashed horizontal orange line and a dotted horizontal orange line, respectively. SNPs significantly associated with gc in MA and AllEnv are represented by blue circles and red triangles, respectively. The most plausible candidate genes within ± 200 kb of the significantly associated SNPs are listed above their corresponding GWAS signal.

