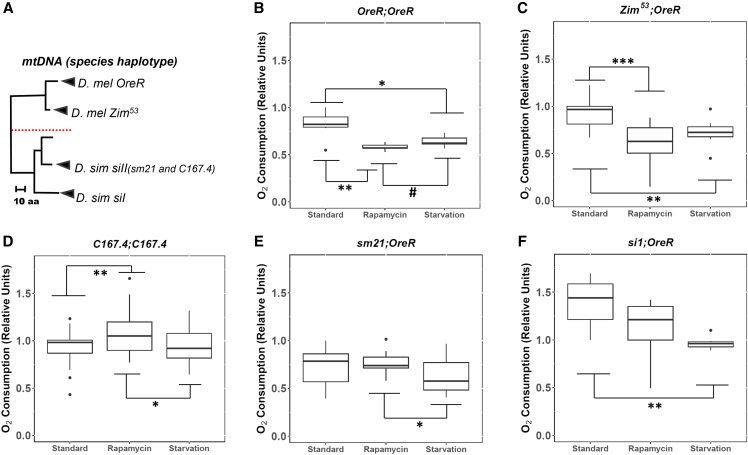
Figure 1.
The effects of rapamycin on the whole-fly metabolic rate across Drosophila from divergent mitochondrial and nuclear lineages. (A) mtDNA phylogeny between the five mitochondrial haplotypes used in this experiment. The tree is grouped based on similarities in the composition of amino acid sequences. The red line demarcates evolutionarily divergent species. The name of the species is followed by the mitochondrial haplotype. In parentheses are the lines from which the mtDNA was isolated (modified and adapted from Montooth et al. 2010). Whole-fly oxygen consumption was measured in coevolved D. melanogaster mtDNA and nDNA: (B) OreR;OreR and (C) Zim53;OreR, D. simulans mtDNA and nDNA: (D) C167.4;C167.4, and the introgressed lines harboring D. simulans mtDNA in D. melanogaster nDNA background: (E) sm21;OreR and (F) siI;OreR after treatment with rapamycin and starvation. For each strain identifier, the left side represents the mitochondrial haplotype, and the right side represents the nuclear background. For each pairwise comparison, the raw p-values, Holm-Bonferroni corrected p-values, and Hedges’ g effect sizes are presented in Table 1 and File S2. # = 0.0.5 < P < 0.1; * = 0.01 < P < 0.05; ** = 0.001 < P < 0.01; *** = P < 0.001.

