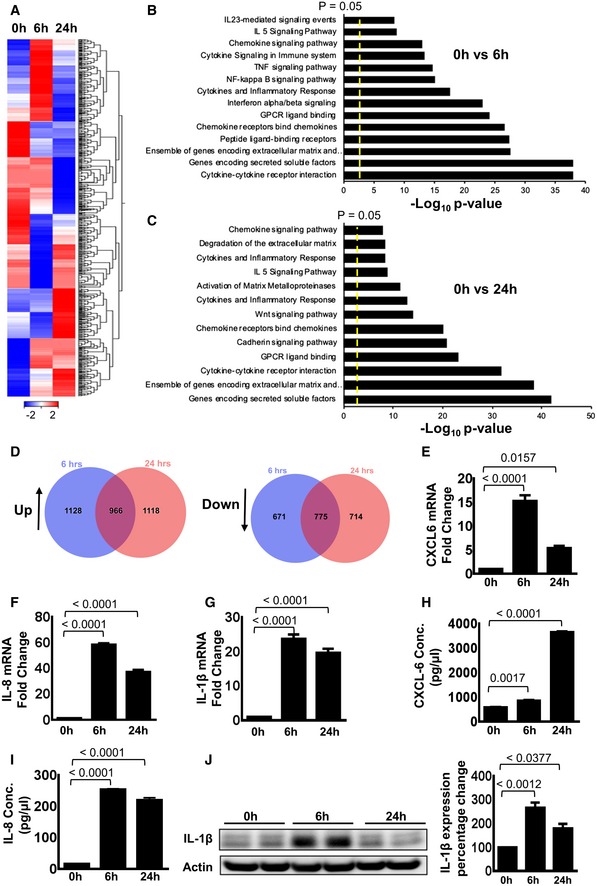
Figure 2. LPS priming leads to profound transcriptomic reprogramming in MSCs.

-
AHierarchical clustering analysis of RNAseq expression profile from MSCs stimulated with LPS for 6 and 24 h. The heat‐map shows the gene expression profile of non‐primed MSCs and MSCs which were LPS primed for 6 and 24 h. Red color represents up‐regulation, while blue color depicts down‐regulation in gene expression; each data point represents FPKM in log2 value.
-
B, CPathway analysis depicts that cytokine–cytokine receptor interactions, genes encoding secreted soluble factors, an ensemble of genes encoding extracellular matrix, chemokine receptors which bind distinct chemokines, GPCR ligand binding, cytokine and inflammatory response, chemokine signaling pathway and IL‐5 signaling are the most dominant pathways as assessed by transcriptional changes when non‐primed and LPS‐primed MSCs were compared at 6 and 24 h after LPS priming.
-
DVenn diagram analysis displays up‐regulated and down‐regulated gene numbers indicated in blue and pink colors, respectively. Purple color indicates the number of shared genes of the up‐regulated and down‐regulated genes at 6 h and 24 h after LPS stimulation. This implies rapid changes of expression of the same genes.
-
E–GValidation of the selected genes uncovered from global RNAseq analyses by qRT–PCR analyses displays up‐regulation of CXCL‐6, IL‐8, and IL‐1β after LPS treatment. Statistical analysis was performed using one‐way ANOVA, and values are represented as mean ± SEM, n = 3 biological replicates.
-
H, IELISA results depict an up‐regulated expression of CXCL‐6 after 24 h of LPS treatment, while a significantly increased IL‐8 expression after 6 and 24 h of LPS treatment. Statistical analysis was performed using one‐way ANOVA, and values are represented as mean ± SEM, n = 3 biological replicates.
-
JWestern blot analysis showed up‐regulation of IL‐1β expression upon LPS priming of LPS‐primed MSCs. Actin served as control. Densitometry graph shows significant increase after 6 h of LPS stimulation compared to non‐primed MSCs. Statistical analysis was performed using one‐way ANOVA, and values are represented as mean ± SEM, n = 3 biological replicates.
Source data are available online for this figure.
