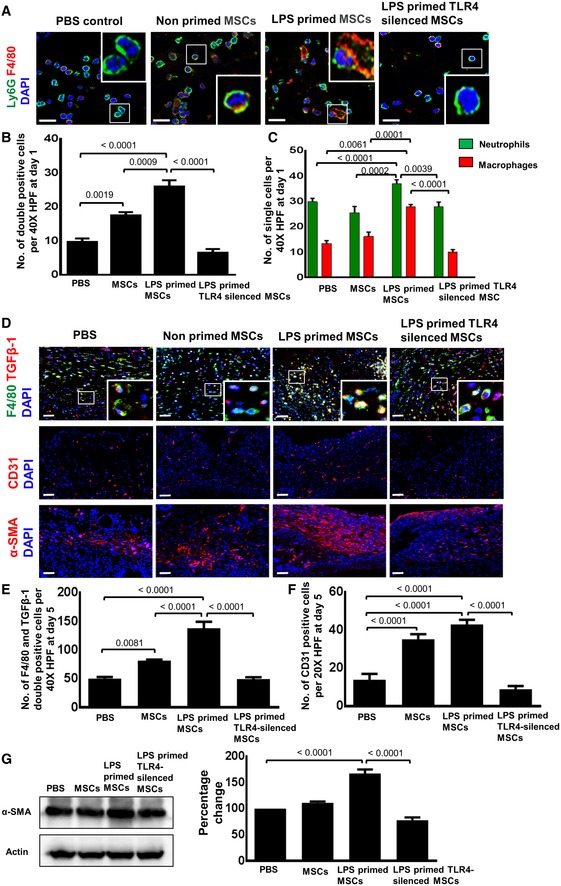
Figure 6. LPS priming of MSCs increased the expression of key proteins promoting granulation tissue formation in TLR4‐dependent manner.

- Representative photomicrographs of confocal microscopy of sections from differently injected day 1 wounds stained for Ly6G+ neutrophils (green) and F4/80+ macrophages (red). Nuclei are stained with DAPI (blue). Double staining was performed for sections of day 1 wounds injected with PBS (control), non‐primed MSCs, LPS‐primed MSCs, and LPS‐primed TLR4‐silenced MSCs. Double‐stained cells indicate phagocytic engulfment of neutrophils by macrophages. To facilitate comparison, areas inside the rectangles are shown at 5× magnification in the insets. Scale bar: 100 μm.
- Quantification of Ly6G and F4/80 double‐positive cells on sections of differently injected day 1 wounds. Wounds were injected as described in (A). Double‐positive cells were counted; statistical analysis was performed using one‐way ANOVA, and values are represented as mean ± SEM, six biological replicates.
- Quantification of Ly6G+ neutrophils and F4/80+ macrophages on sections of differently injected day 1 wounds. Wounds were injected as described in (A). Single‐positive cells were counted; statistical analysis was performed using one‐way ANOVA, and values are represented as mean ± SEM, six biological replicates.
- Representative photomicrographs of confocal microscopy of sections from differently injected day 3 wounds double‐stained for TGFβ‐1 (red) and for F4/80+ macrophages (green). Nuclei are stained with DAPI (blue). Double staining was performed for sections of day 5 wounds injected with PBS (control), non‐primed MSCs, LPS‐primed MSCs, and LPS‐primed TLR4‐silenced MSCs. Scale bar: 50 μm. Representative photomicrographs of sections of day 5 wounds immunostained for CD31 (indicative of endothelial cells and newly formed vessels) and for α‐SMA (indicative of myofibroblasts differentiation) after injection of LPS‐primed MSCs, non‐primed MSCs, LPS‐primed TLR4‐silenced MSCs or PBS (middle and lower panel). To facilitate comparison, areas inside the rectangles are shown at 5× magnification in the insets. Scale bars: 50 μm.
- Double‐positive macrophages stained for TGFβ‐1 and F4/80 were counted; statistical analysis was performed using one‐way ANOVA, and values are represented as mean ± SEM, six biological replicates.
- Quantitative analysis of CD31‐positive endothelial cells in sections of wounds injected with PBS, non‐primed MSCs, LPS‐primed MSCs, and LPS‐primed TLR4‐silenced LPS. Cell counting was performed on immunostained wound sections; statistical analysis was performed using one‐way ANOVA, and values are represented as mean ± SEM, six biological replicates.
- Western blot analysis of lysates from day 5 wounds (left panel) and the corresponding densitometric analysis (right panel) depict enhanced α‐SMA protein expression in wounds injected with LPS‐primed MSCs as opposed to the respective control groups. Actin served as loading control. Statistical analysis was performed using one‐way ANOVA, and values are represented as mean ± SEM, three biological replicates.
Source data are available online for this figure.
